Interactive Heatmaps
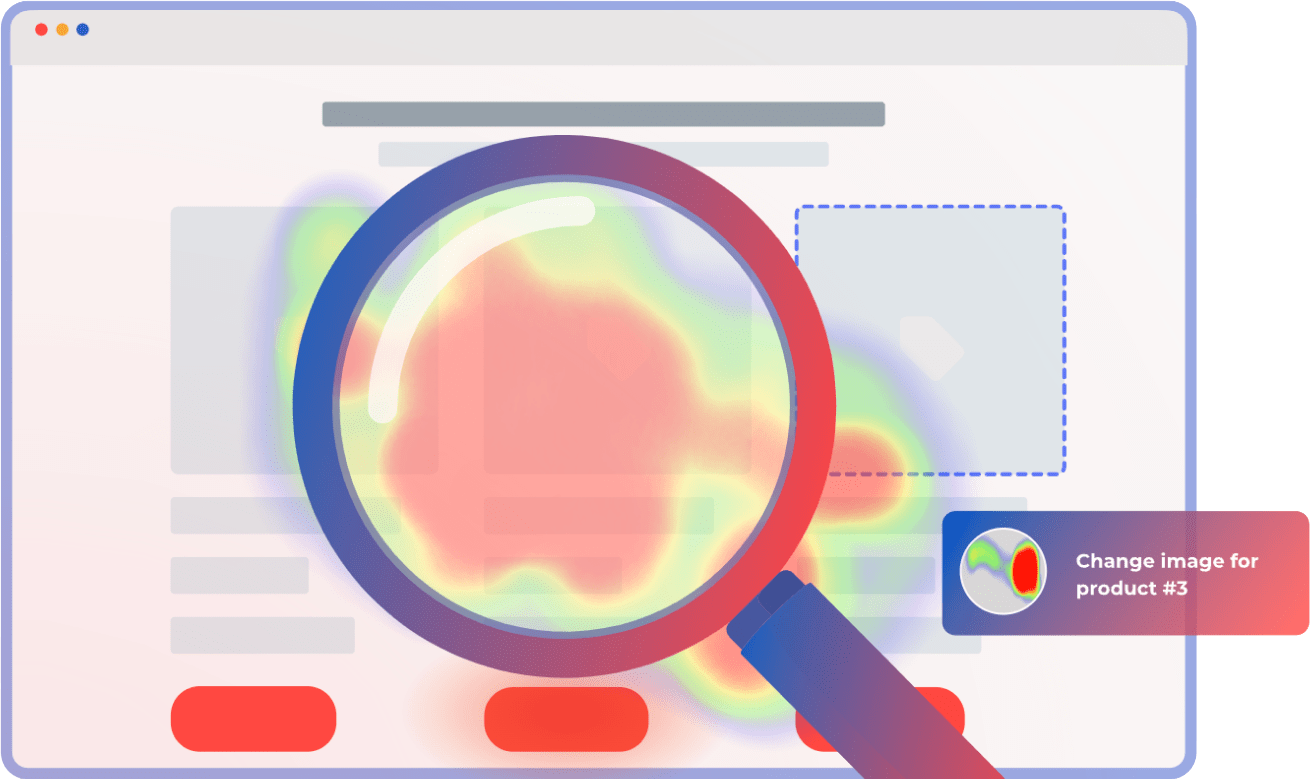
Go beyond static heatmaps track dynamic elements such as pop-ups, hidden items, drop down menus etc.

Find out which items attract attention and which ones are most important to your users.
No need to wait for your heatmap tool to process data anymore, view it in real-time.
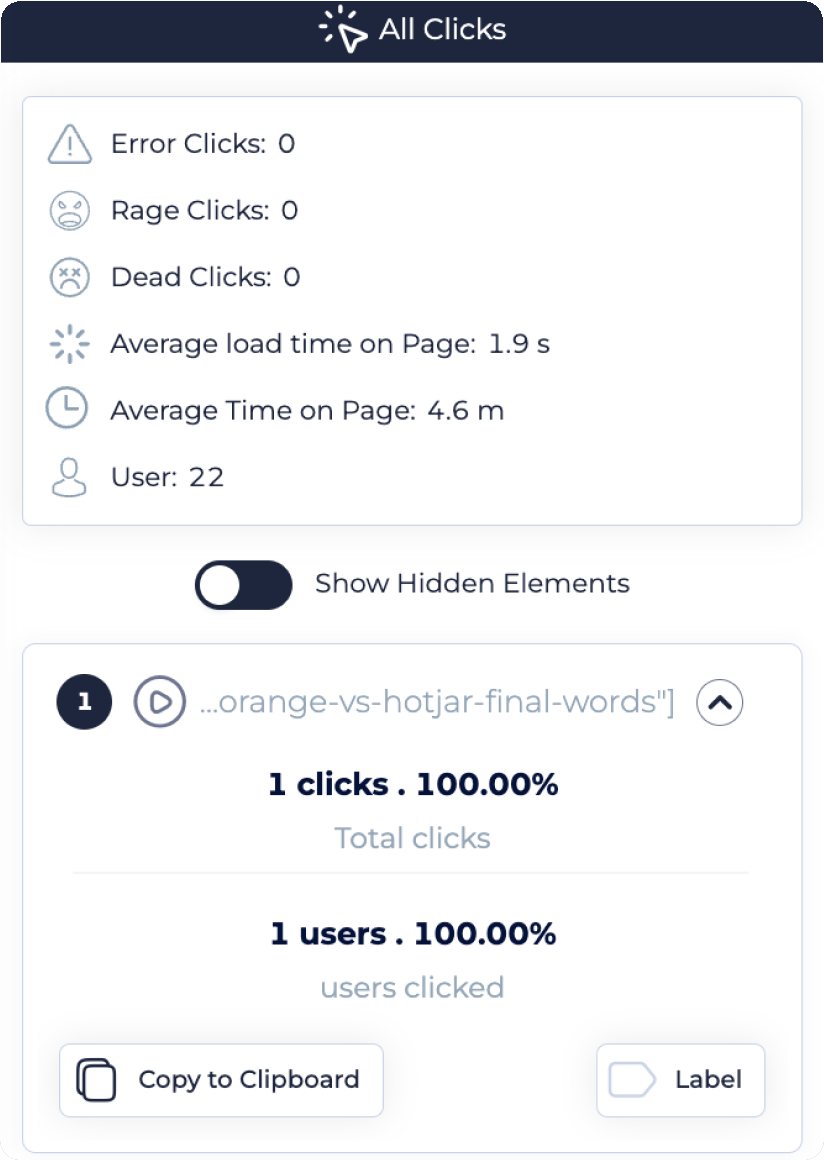
Never miss any click, scroll, hover, and identify key elements that captures users’ attention.
Check the pulse of any page on your site or app to see how users are navigating and exploring your content.

Understand Scroll Depth
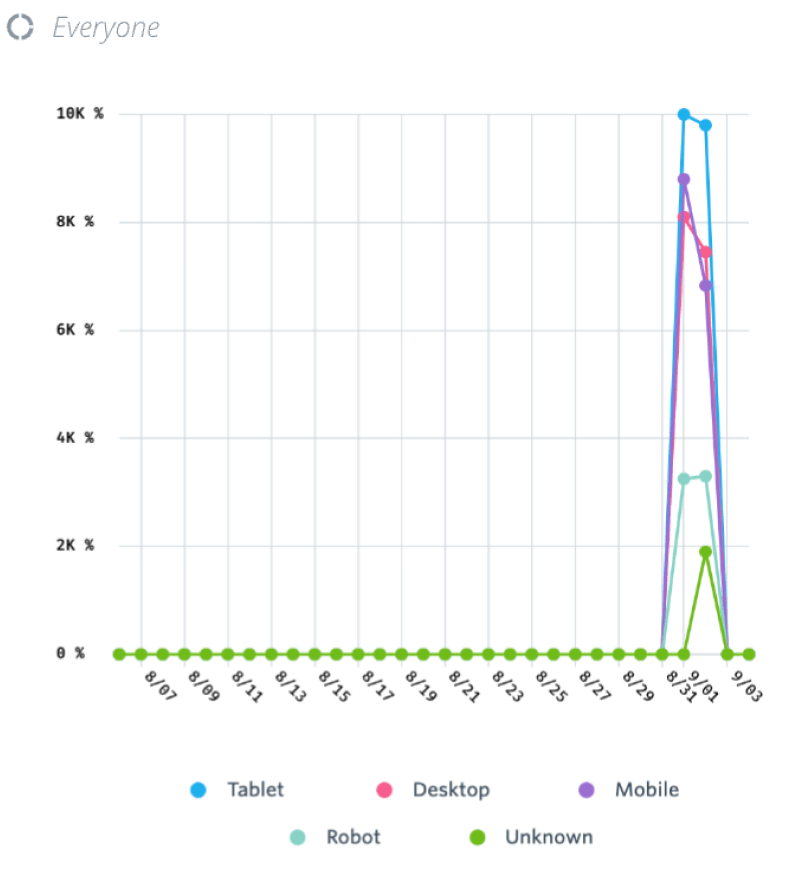
With trend cards, you can break down a single segment by dimension (seen here) or compare multiple segments over time. Great for A/B Tests, First vs. Return Users, etc.
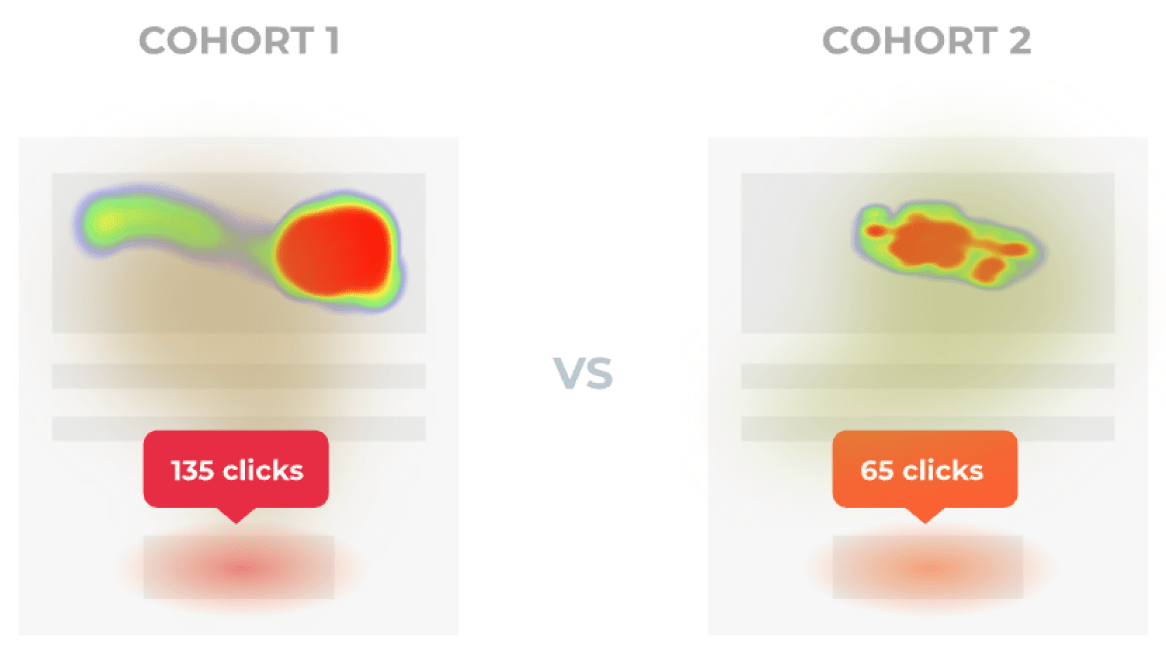
Compare Heatmaps from different cohorts
Find out if one type of audience is behaving differently than the other.


Track how your users navigate
Track events that led to conversions and see how they contributed to achieving your goals.