Customer journey analytics is the process of analyzing how people move across touchpoints, stages, and interactions so you can understand what drives conversion, where users get stuck, and which improvements will have the biggest business impact.
In simple terms, it helps you see the real customer journey — not just isolated pageviews or events.
In this guide, you’ll learn:
- what customer journey analytics is
- how it differs from customer journey mapping and funnel analysis
- which metrics matter most
- how to use journey data to reduce friction, improve conversion, and strengthen retention
If you are comparing platforms, pricing, and features, also see our guide to the best customer journey analytics software.
Looking for tools instead of theory?
If you want to compare platforms, pricing, and features, see our guide to the best customer journey analytics software.
Basics of Customer Journey Mapping
Image source: Finance Online
Customer journey mapping is a process where you visually represent the entire customer journey, meaning customCustomer journey mapping and customer journey analytics are closely related, but they are not the same thing.
Customer journey mapping is a planning exercise. It helps you visualize the stages, touchpoints, expectations, and pain points a customer may experience.
Customer journey analytics measures what customers actually do across those touchpoints using behavioral and conversion data.
A simple way to think about it:
- Journey mapping shows the expected path
- Journey analytics shows the real path
- Funnel analysis measures progression through a defined conversion sequence
Journey mapping is useful for aligning teams. Journey analytics is what helps you validate the map, spot friction, and improve real outcomes.
What is Customer Journey Analytics?
Customer journey analytics is the process of collecting and analyzing customer interactions across touchpoints so you can understand how people move from awareness to conversion, retention, or churn.
Unlike traditional analytics, which often focuses on individual events or pages, customer journey analytics looks at the full path customers take. That makes it easier to identify:
- where users drop off
- which touchpoints create friction
- how different segments behave
- which improvements are most likely to increase conversion or retention
In practice, customer journey analytics combines journey visibility with behavioral evidence. It helps teams move from “what happened” to “why it happened” and “what should we improve next.
Analyze User Behavior With FullSession
Capture all user interactions, spot trends and patterns and drive improvements without compromising your website performance.
Why Invest In Customer Journey Analytics
Customer journey analytics lets you see all the touchpoints where users interact with your site. Their actions could include browsing, clicking, and purchasing. Having a full view of the journey helps you spot trends and patterns.
Data analysis will tell you why customers behave in certain ways. Recognizing and meeting customer needs can lead to higher satisfaction and loyalty, so they’ll keep coming back.
It can guide website improvements, product offerings and marketing strategies. Effective use of customer journey analytics can even increase your conversion rates and revenue.
Tools for journey tracking and visualization help make sense of the complex web of interactions happening across the site. With this knowledge, you can make smart decisions to improve user engagement and reach business goals.
How FullSession Supports Customer Journey Analysis
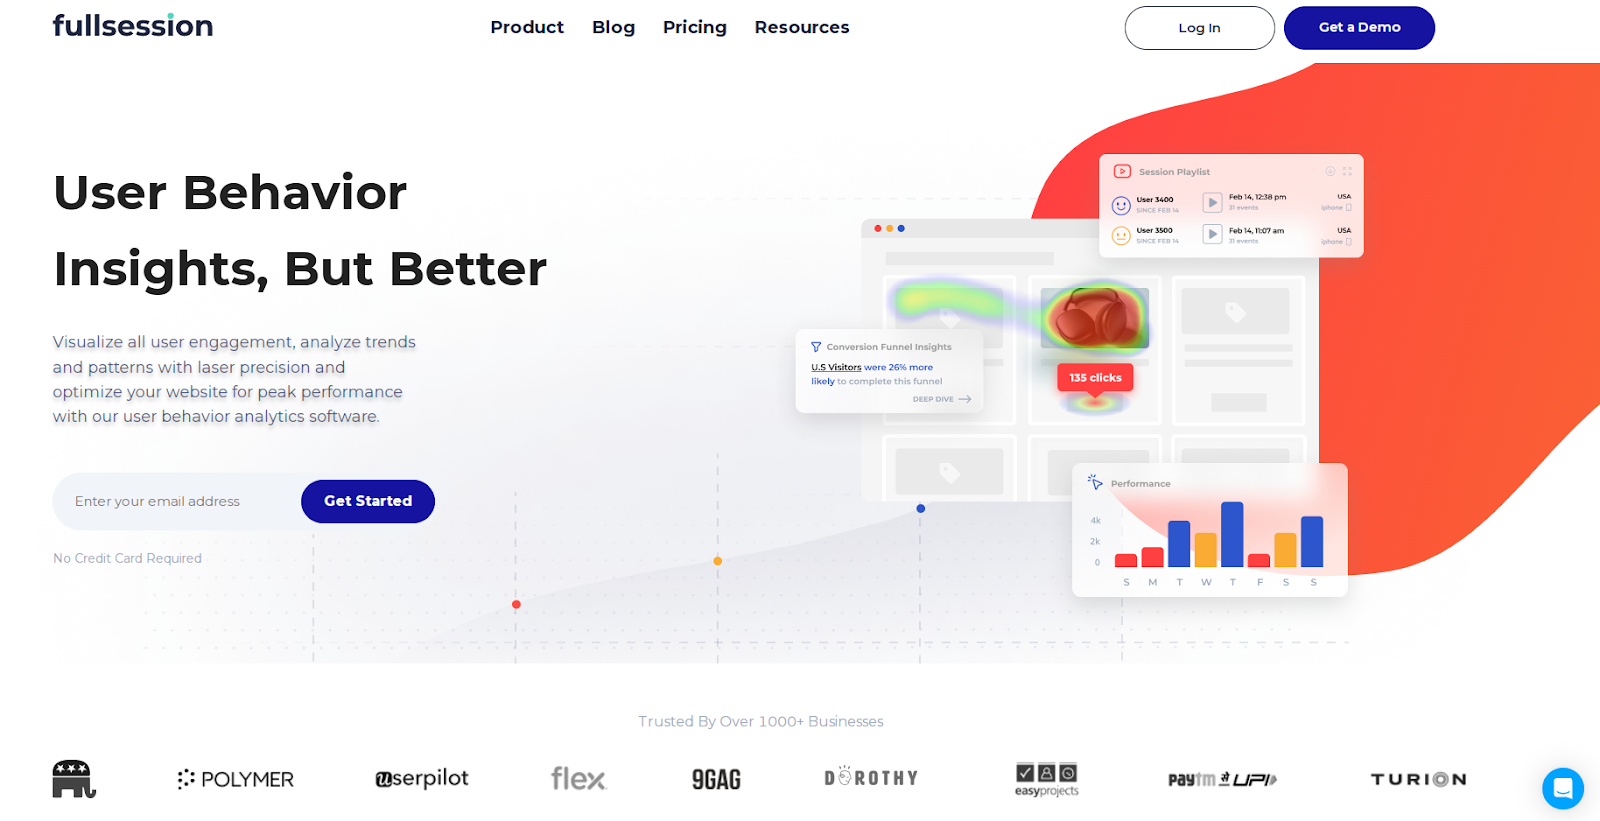
When you choose FullSession as your customer journey analytics tool, you get advanced insights into user behavior. It helps you capture, visualize and analyze user engagement with ease.
The intuitive dashboard gives you a 360-degree view of user behavior data, showing how users interact with your site in real time.
You can watch user sessions to see how individuals navigate your site and analyze interaction data to predict customer behavior better.
With interactive heatmaps, you can detect dead zones on your pages to improve your website’s interface, usability and performance. You can test different page elements and validate design changes to see what works best.
Optimizing key touchpoints in yourconversion funnels is crucial. FullSession helps identify conversion blockers and minimize drop-offs. Based on this feedback, you can ensure a smoother journey for your customers.
FullSession allows you to gather direct user feedback. You’ll know the reasons behind any user frustration and can act quickly to solve these issues. It improves your customer experience initiatives.
Security is a top priority with FullSession. It complies with privacy standards like GDPR, PCI and CCPA, making it a reliable and secure customer journey analytics solution. With FullSession, you put your users’ privacy first while gaining the insights you need.
Visualize, Analyze, and Optimize with FullSession
See how to transform user data into actionable insights for peak website performance.
Session recordings and replays
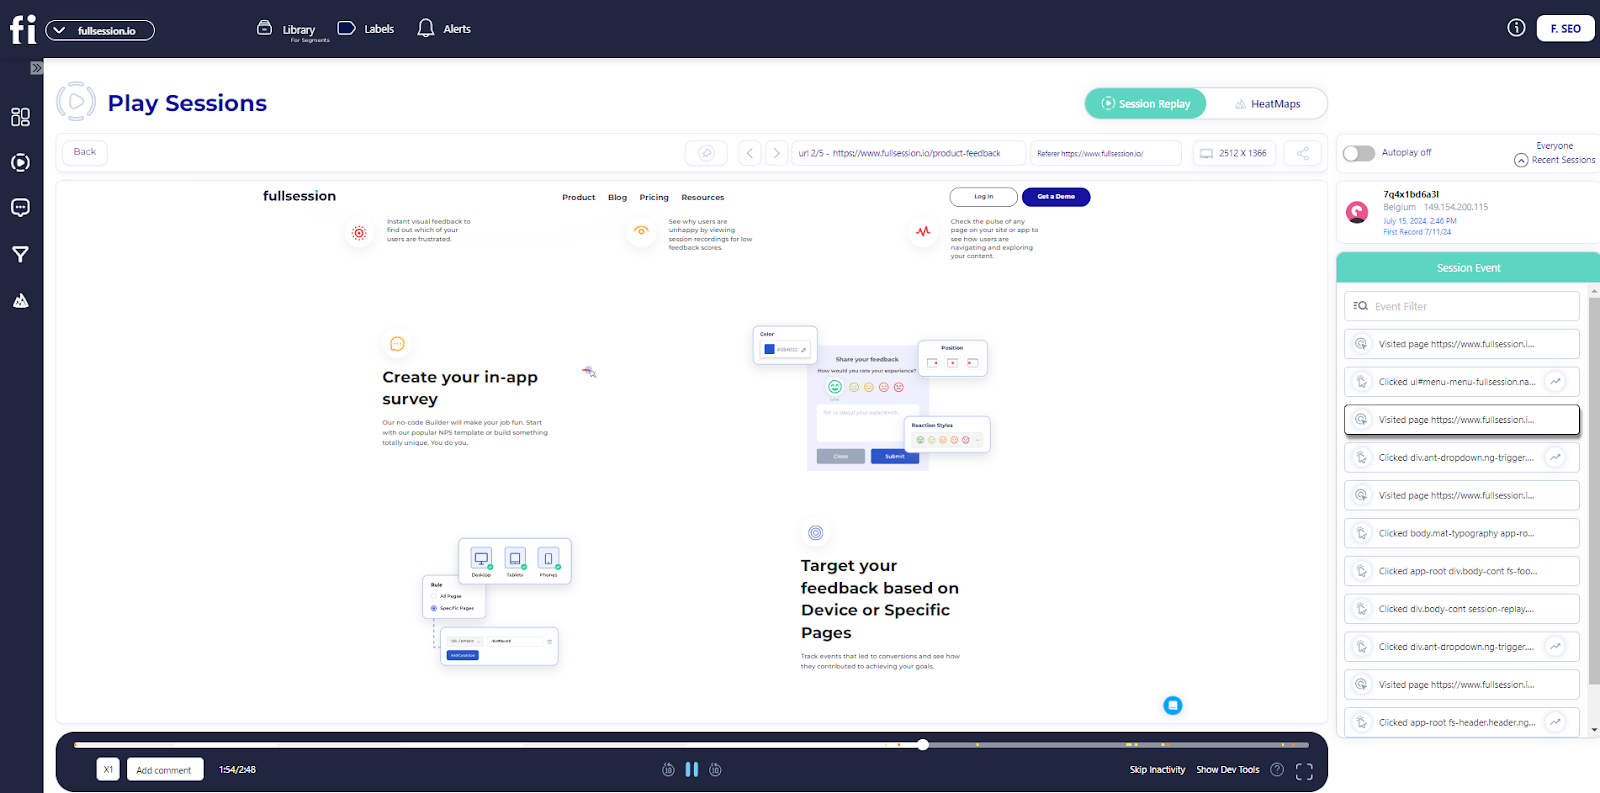
Session recording and replay tools will show how users advance through your site. You can see mouse movements, clicks and scrolling patterns to understand user behavior.
- Issue identification: Find broken links, bugs and usability problems.
- Time tracking: See how long users stay on each page.
- Trend analysis: Get an overview of user interactions to spot trends.
- Marketing impact: Measure how well campaigns perform based on user activity.
- Referrals: See which websites or campaigns drive traffic to your site.
With session recordings and replays, you can also track:
- Session list: Get an overview of all recorded user sessions.
- User location and IP address: Identify where your users are coming from.
- Date and time of the visit: Know when users interact with your site.
- Device usage: Understand which devices and browsers your users prefer.
- Visited pages: See which pages are most popular.
- Session events: Analyze specific user actions within a session.
You can skip user inactivity to speed up your analysis, apply advanced filters to identify critical events in a user session or share the recording with your team.
Scroll, click and mouse movement heatmaps
With website heatmap tools, you can better understand the customer journey.
Interactive heatmaps help you see how users engage with your website. They create a visual, color-coded report showing which parts of your site get the most or least engagement.
In e-commerce, heatmaps help you discover if page elements catch users’ attention. You can find out if users click the product images, call-to-action buttons or face issues with web forms.
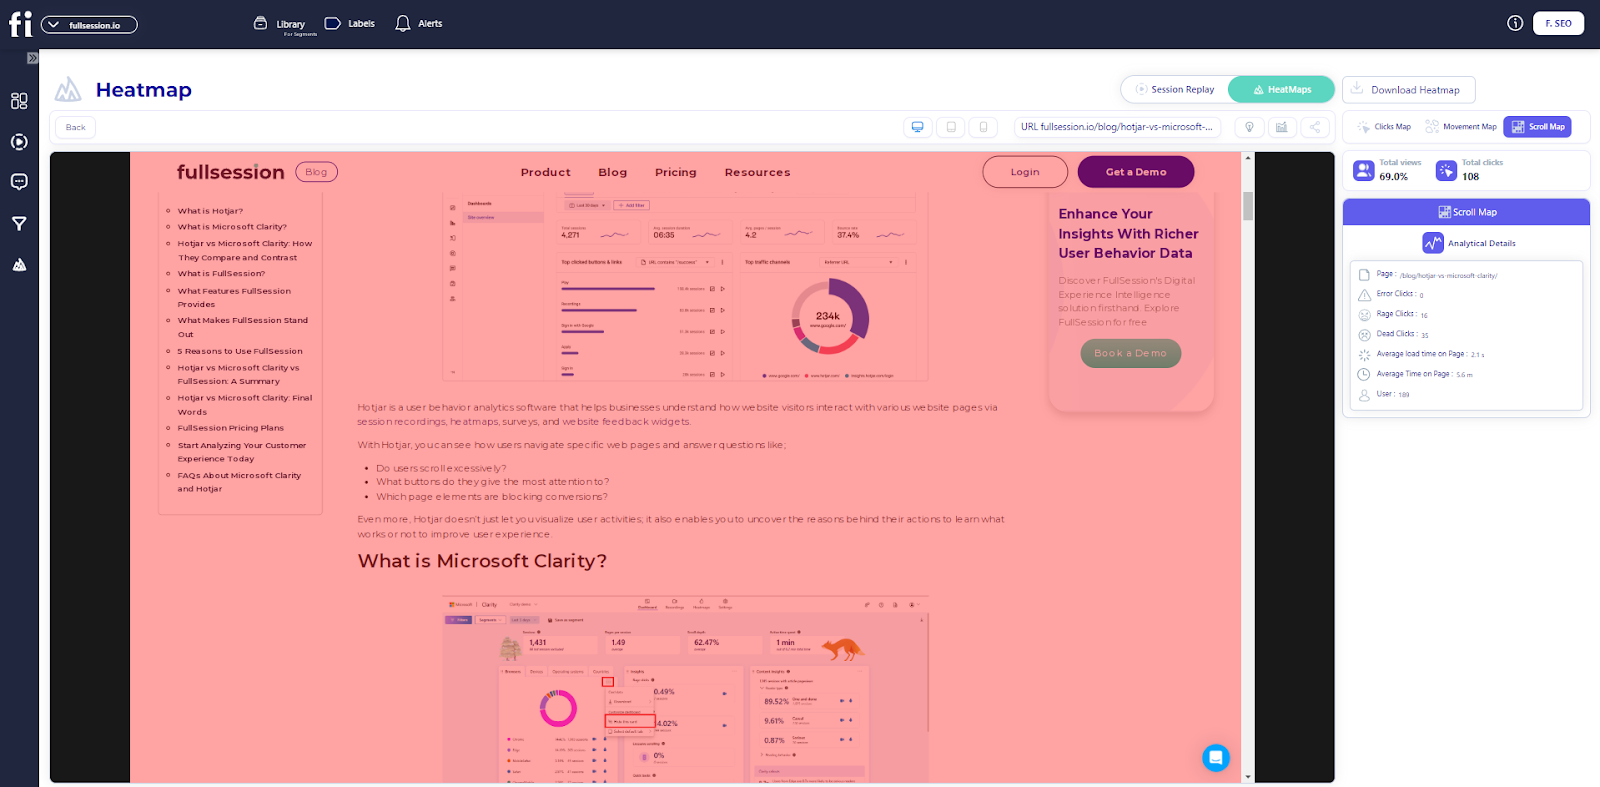
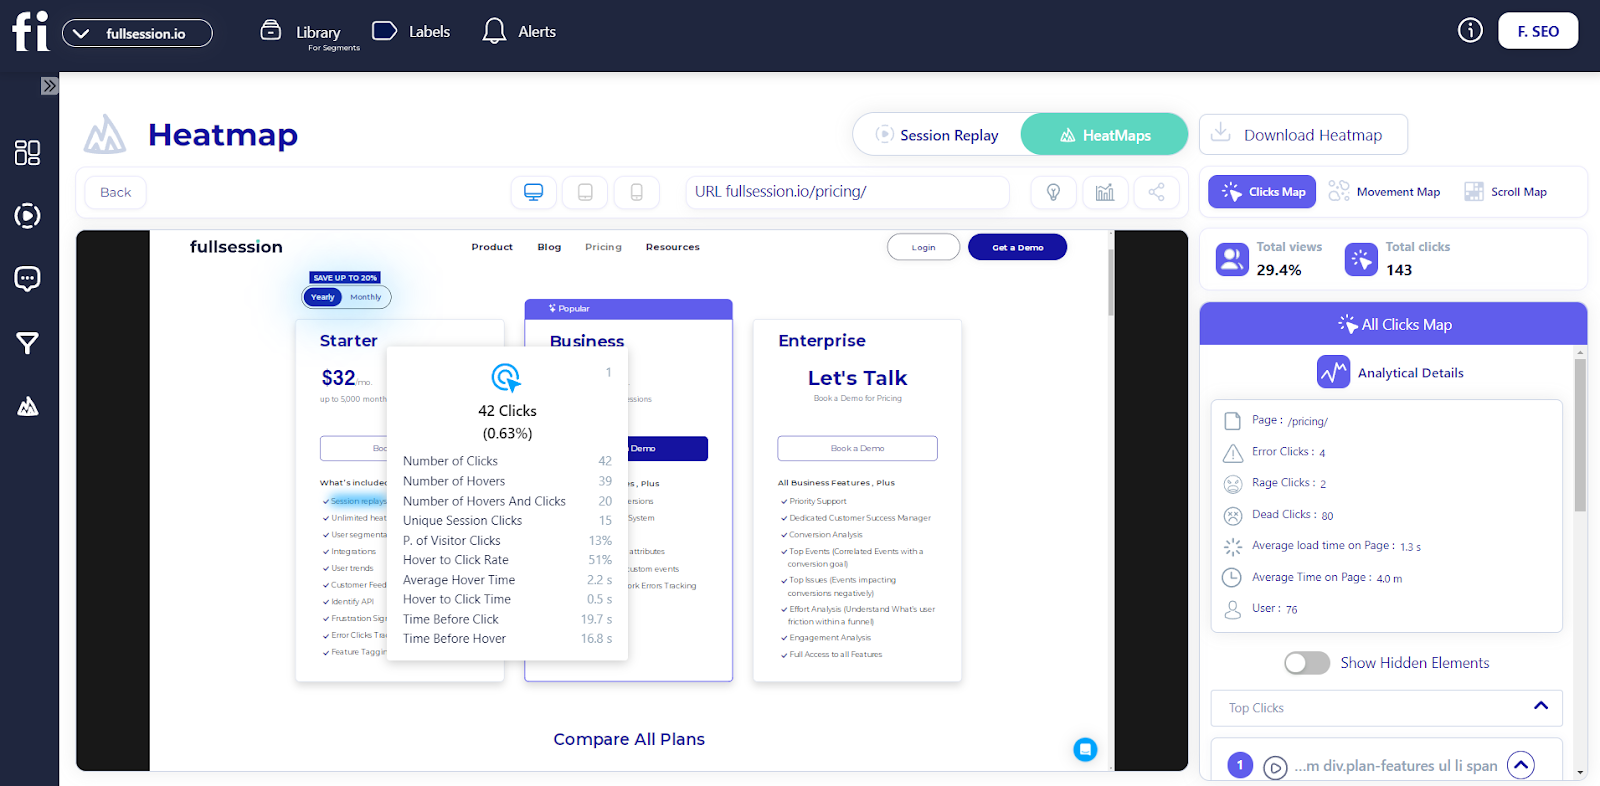
FullSession provides three main types of interactive heatmaps:
- Scroll maps show how far down a page users scroll.
- Click maps highlight popular click areas.
- Mouse maps track user navigation patterns.
With FullSession heatmaps, you can capture:
- Visited URL: See which pages users are visiting.
- Device used: Understand which devices and browsers your users prefer.
- Average load time on page: Monitor page performance and its impact on user engagement.
- Average time on page: Determine which pages hold users’ attention the longest.
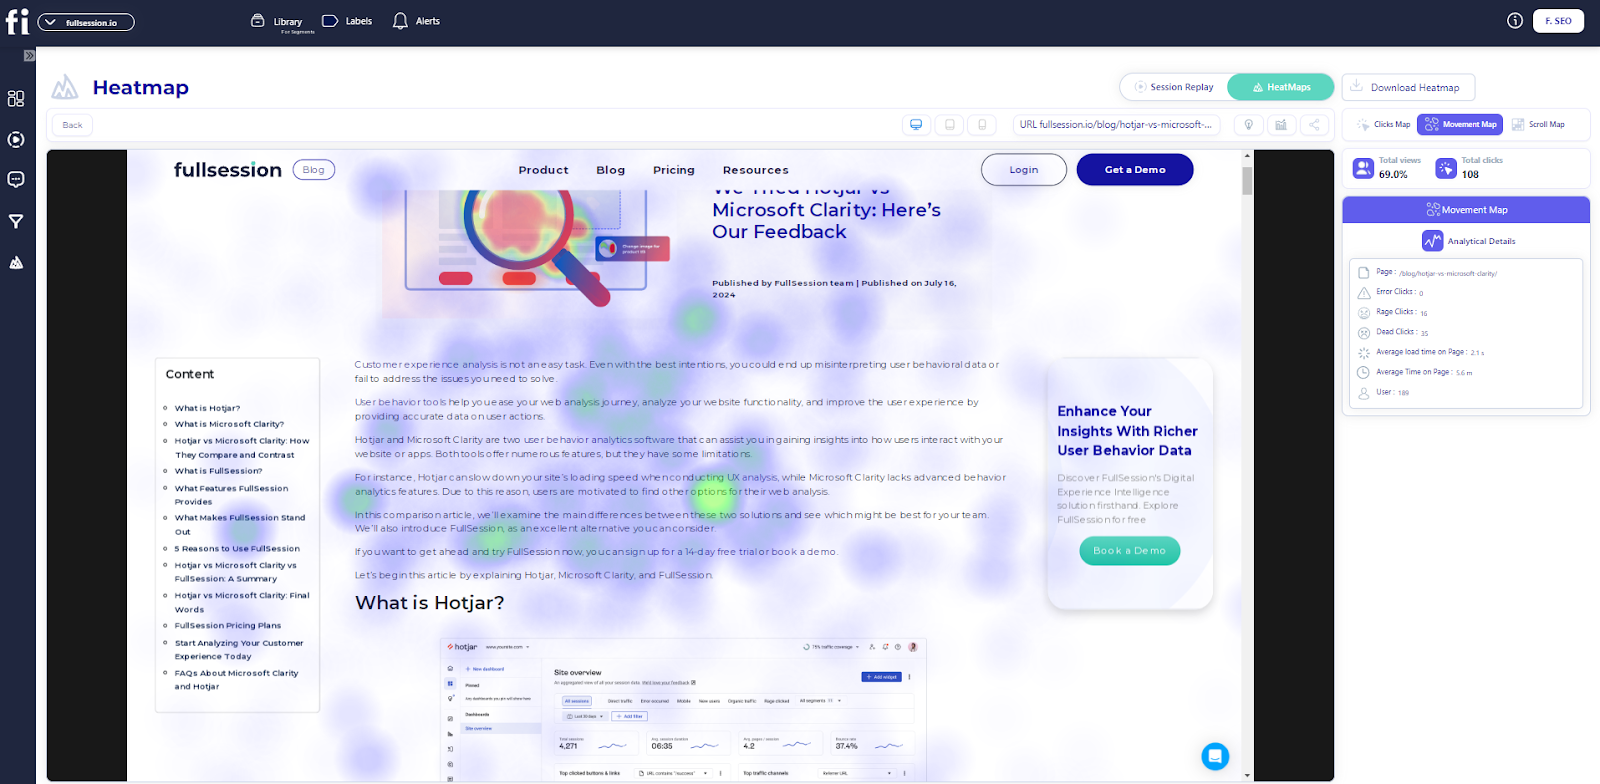
You can monitor specific user interactions like:
- Overall clicks: Identify the most engaging elements on your site.
- Rage clicks: Spot areas where users repeatedly click on unresponsive elements.
- Dead clicks: Identify clicks on non-interactive elements.
- Error clicks: Detect areas where users are experiencing issues.
Additional features:
- Share the heatmap: Collaborate with your team by sharing heatmap insights.
- Download the heatmap: Save heatmaps for offline analysis or presentations.
By analyzing these details, you can make strategic changes to improve your site’s performance and user satisfaction.
Website feedback forms
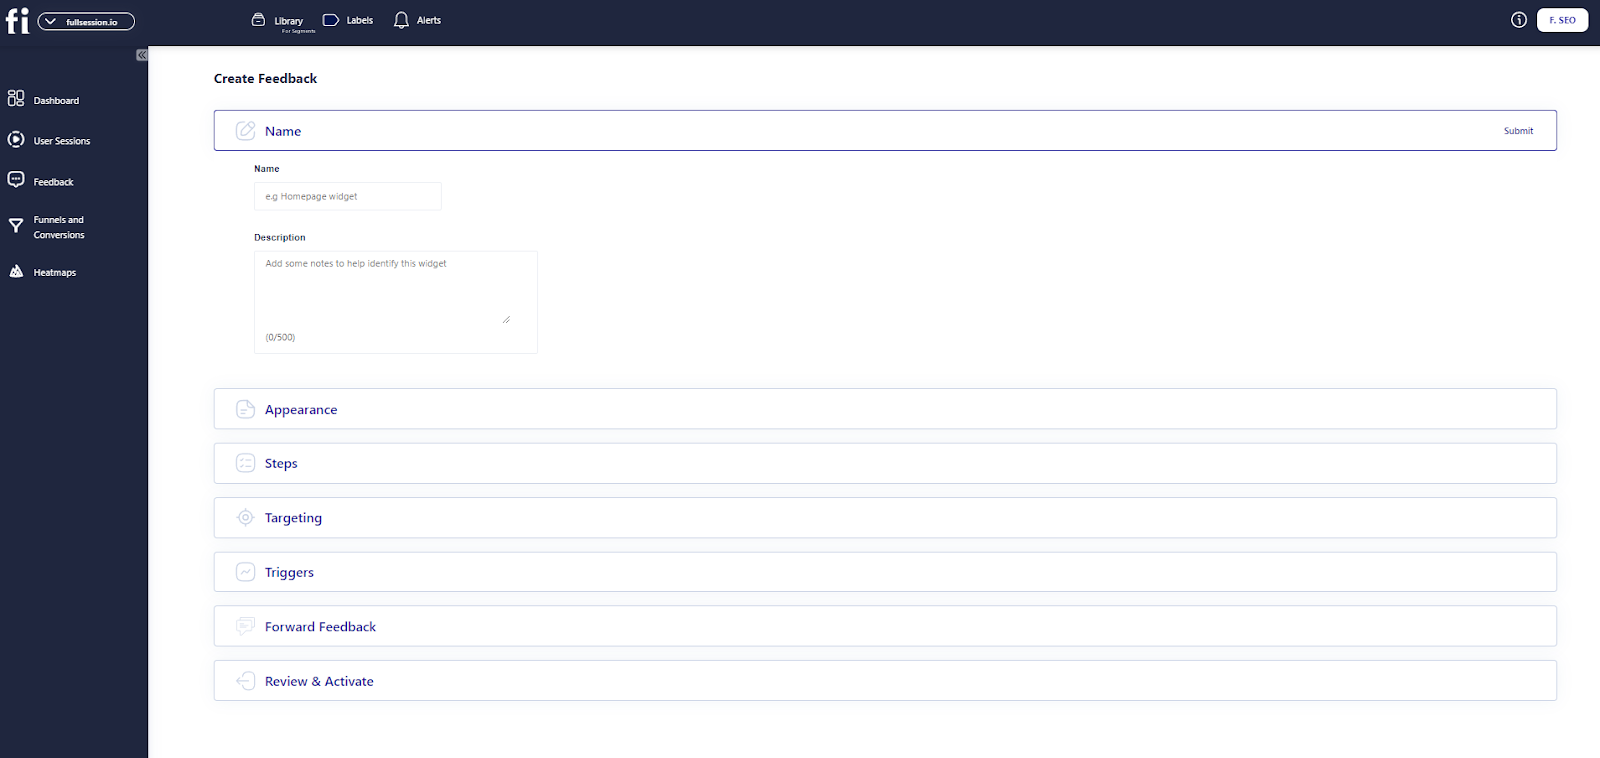
Website feedback forms are a great way to learn what users think about your site. These customer feedback collection tools give you immediate insights into your website’s performance to make necessary improvements.
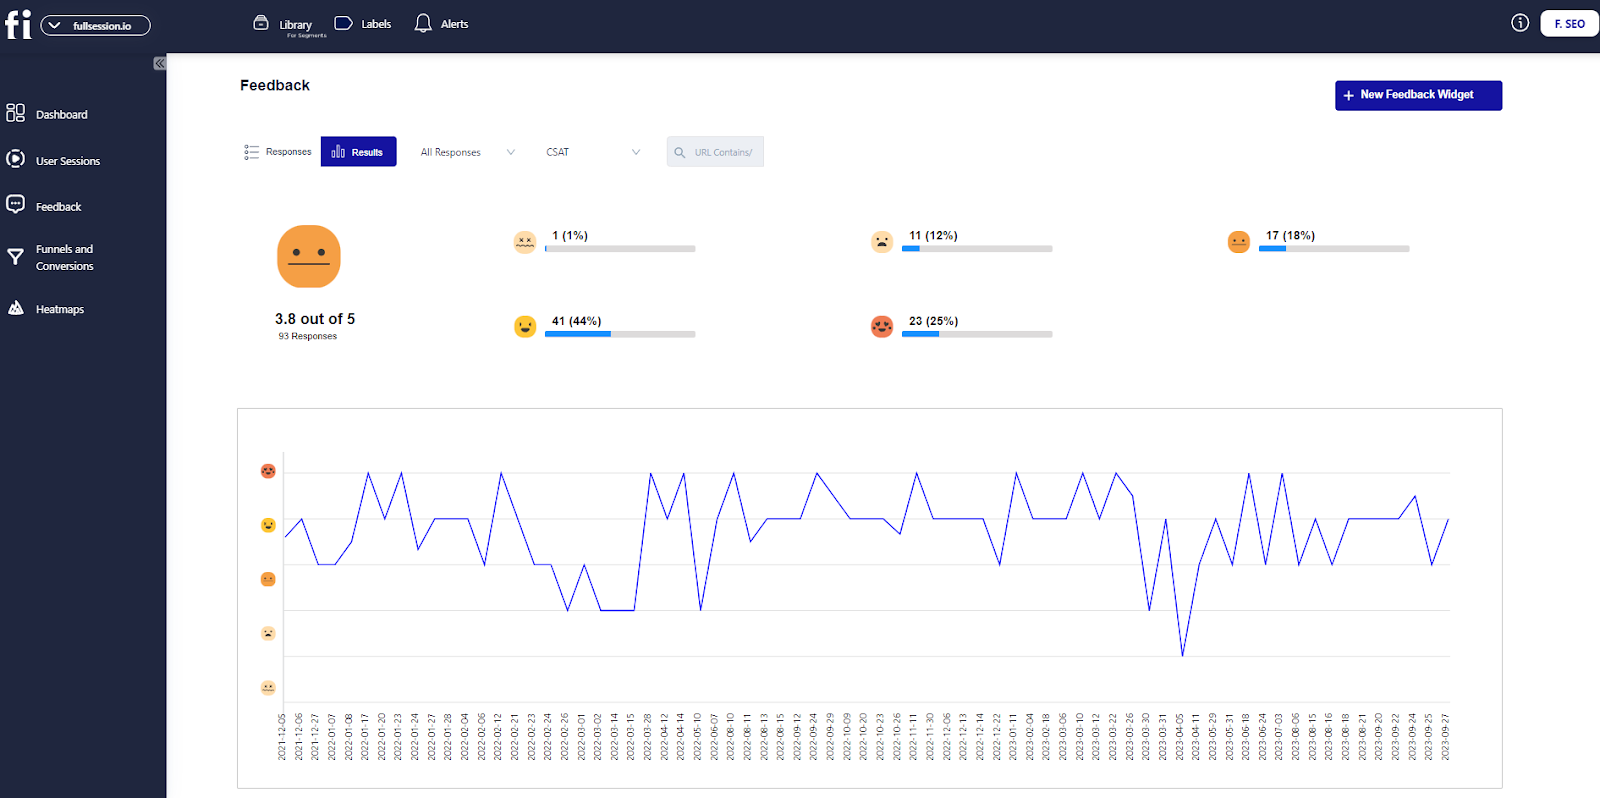
With FullSession, you can create branded feedback forms, evaluate customer feedback reports to understand their sentiments and get more information about your users:
- Email address
- Location
- The feedback customers submitted
- Device type
- Date of feedback
- URL they engaged with
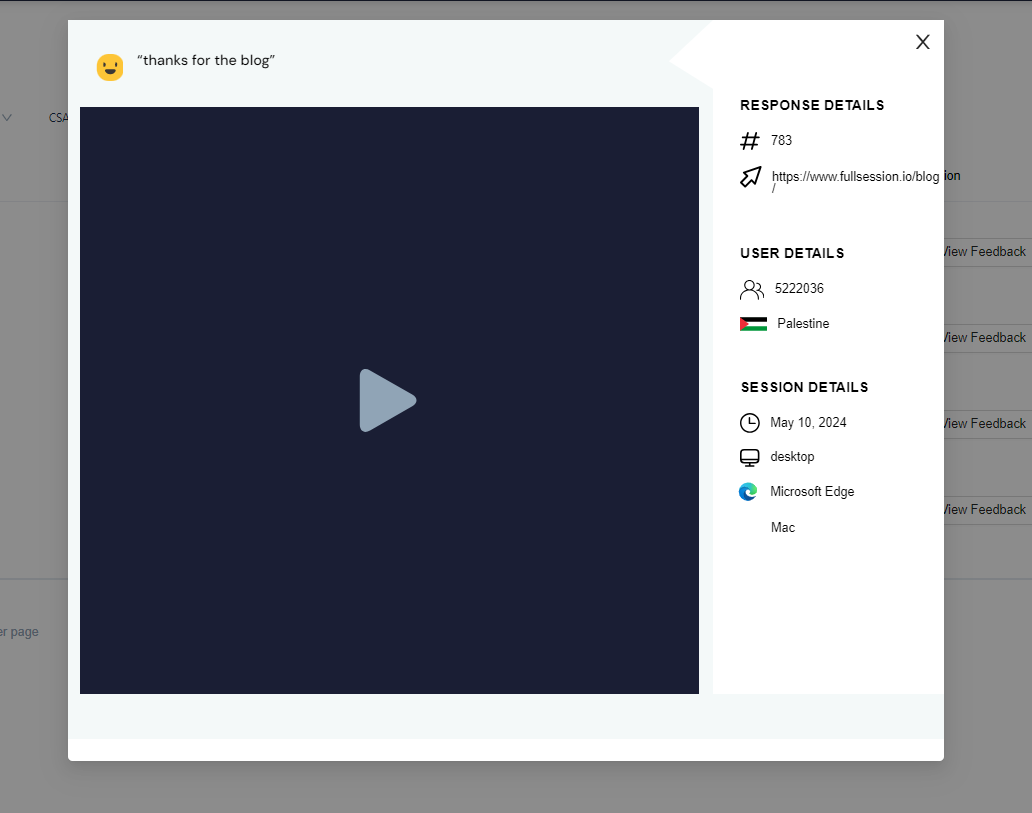
You can watch connected session recordings to see user actions firsthand and pinpoint where they experience issues to understand their feedback better.
Turn User Behavior into Growth Opportunities
Learn how to visualize, analyze, and optimize your site with FullSession.
Conversion funnel analysis
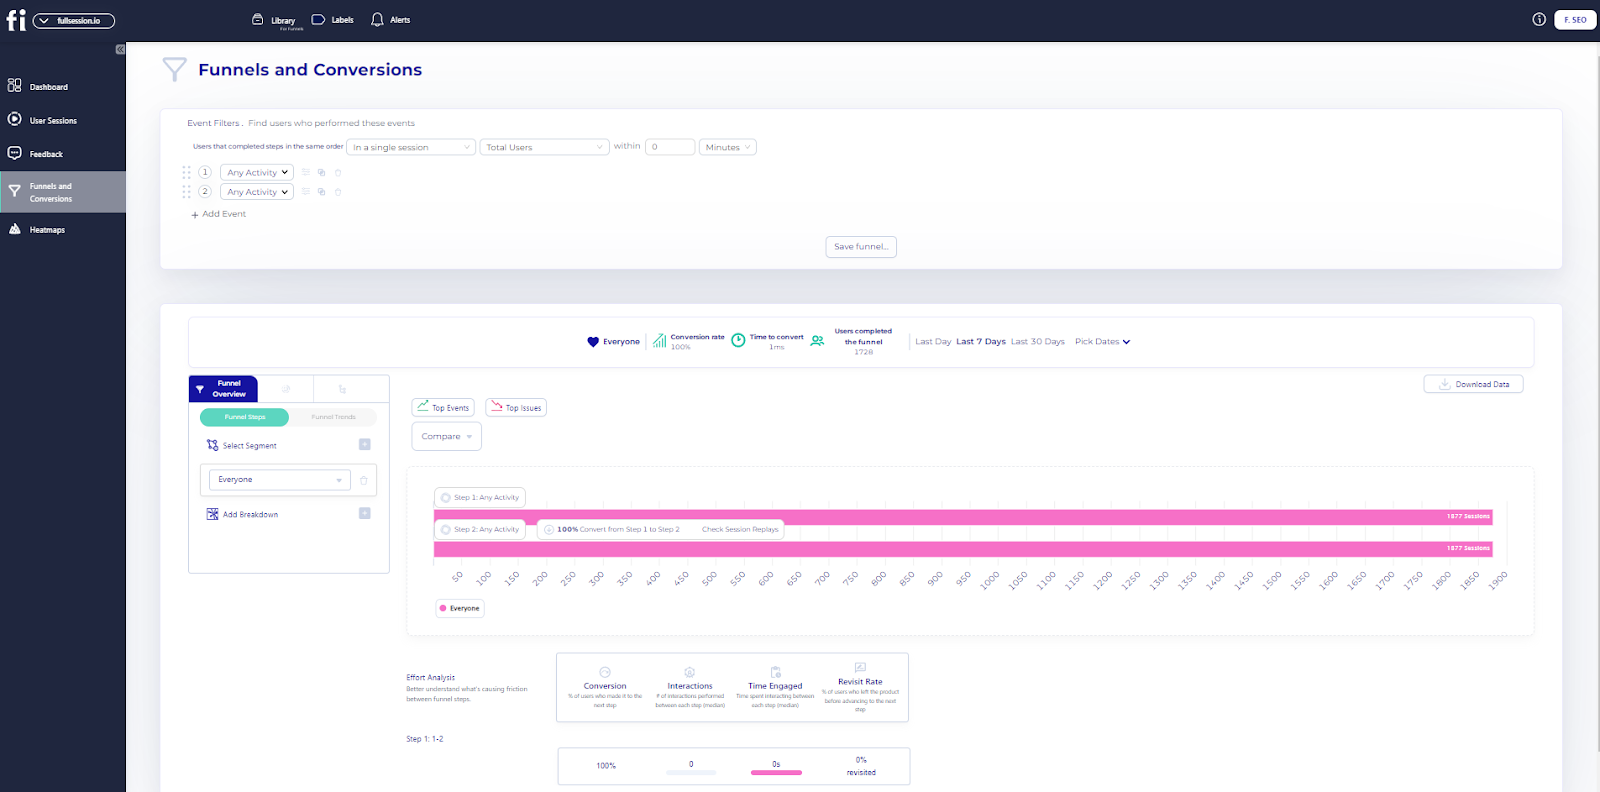
Understanding your conversion funnel is key to improving your user’s experience. With FullSession conversion funnel analysis, you can dig into each step of your funnel to see where users convert or drop off.
Funnel steps let you visualize this progression, helping you spot where improvements are required.
Monitoring funnel trends over time lets you track how the user flows, and conversion rates change. This insight can guide you in tweaking your strategy to boost sales or engagement.
Pinpoint top events that drive conversions. By focusing on users’ actions before they convert, you can amplify these successful steps. Conversely, identifying top issues frustrating users allows you to make necessary fixes.
Measure how long users engage with specific parts of your product. The time-engaged feature highlights where users might be facing frustrations. Steps with the most interactions could indicate interest or confusion, so optimizing these top-engaged steps is necessary.
The revisit rate helps you understand how often users exit before moving forward, which can point to stumbling blocks in your funnel. By examining this data, you can rework these areas to make transitions smoother.
Segment analysis allows you to compare user behaviors between different groups. It is important to tailor experiences to diverse demographics.
Also, using period comparison allows you to track trends and performance over different periods, allowing for more strategic planning.
Website error tracking
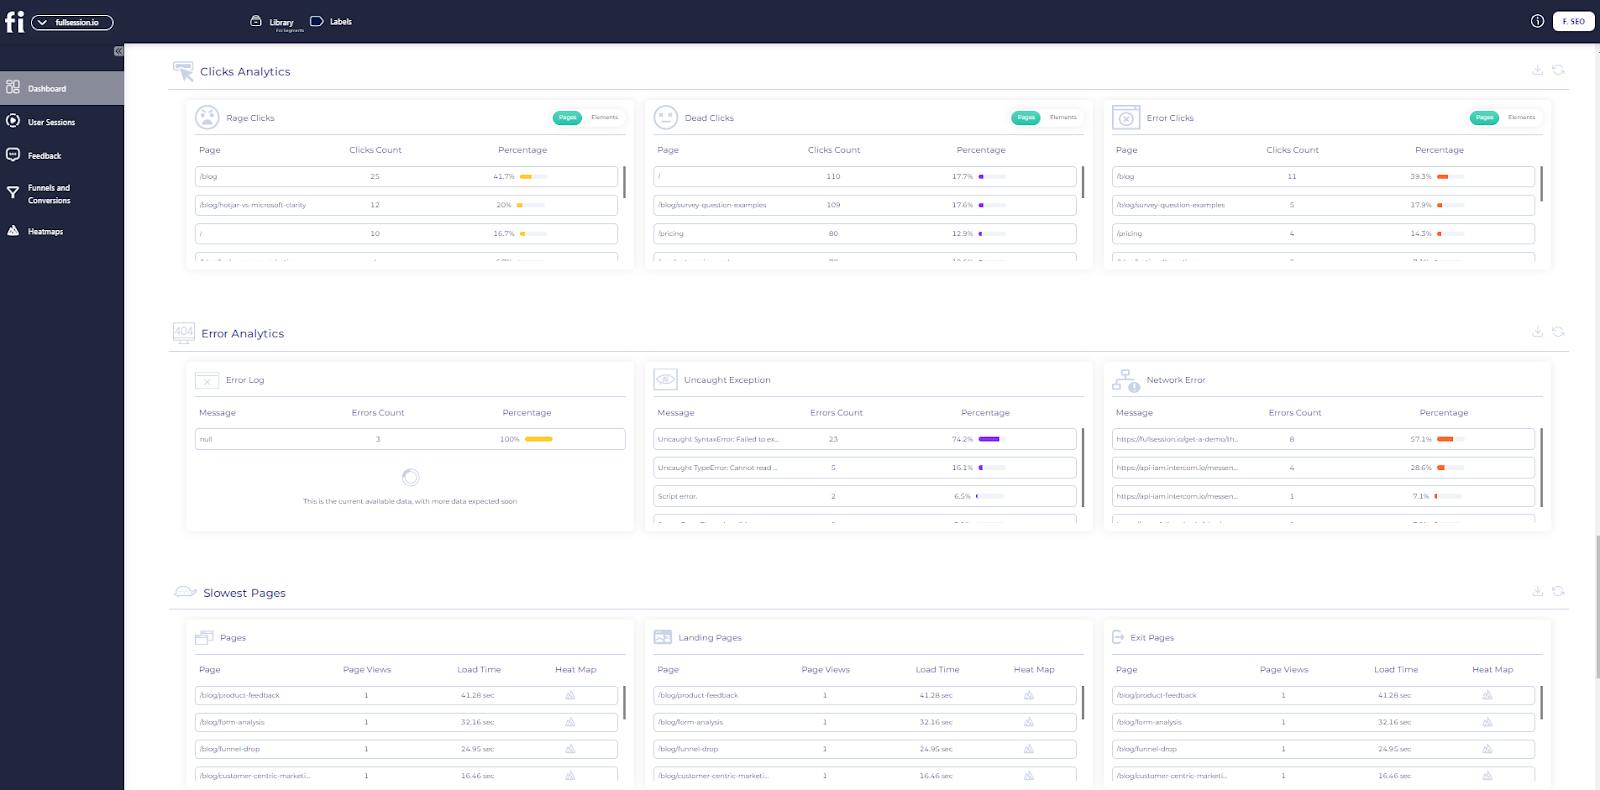
Understanding website issues is necessary for user experience analysis. FullSession offers one of the best website monitoring tools to identify and fix these problems.
- Error clicks: Session replays can highlight where users encounter unresponsive elements. It allows you to fix buttons or links that are not working as they should.
- Network errors: You can track server request failures and analyze why specific requests don’t complete. It helps you find server issues that might disrupt your site.
- Console errors: Logging JavaScript errors is made easier with session replays. You get to see how these errors affect the user journey on your website.
- Error logs: These logs collect important details that make debugging simpler. Having the right information at your fingertips makes it easier to understand what went wrong.
- Uncaught exceptions: Manage critical errors by monitoring and handling them before they cause website crashes. It ensures your site remains stable and reliable.
- Error trends: Visualizing error patterns over time allows you to see recurring issues. Understanding trends helps you take proactive steps in resolving problems.
- Alerts: Get real-time alerts through platforms like Slack. You can customize these notifications to fit your operational needs, ensuring you’re always in the loop.
Use customer journey analytics to increase your website visitors’ overall reliability and satisfaction.
Why Choose FullSession for Customer Journey Analytics
FullSession is perfect for customer journey analytics as it helps you see the entire customer experience on your website. With FullSession, you can track dynamic website elements in real time and get precise user behavior data without slowing down your site.
FullSession lets you watch actual user sessions and connect data analysis to the real customer experience. It means you can see why users take certain paths in their journey.
The platform also respects user privacy by not recording any sensitive data. You can manage and analyze large datasets to get instant answers and inform your customer experience strategy.
Only tracking behavior on your site, FullSession, prevents data misuse. It also allows seamless collaboration across teams to unify efforts to optimize the customer journey in one place.
FullSession gives you real-time, privacy safe and actionable customer journey analytics to make meaningful changes to the user experience. Its robust, easy-to-use features make it the perfect solution for any business to understand and serve customers.
How to Start With FullSession
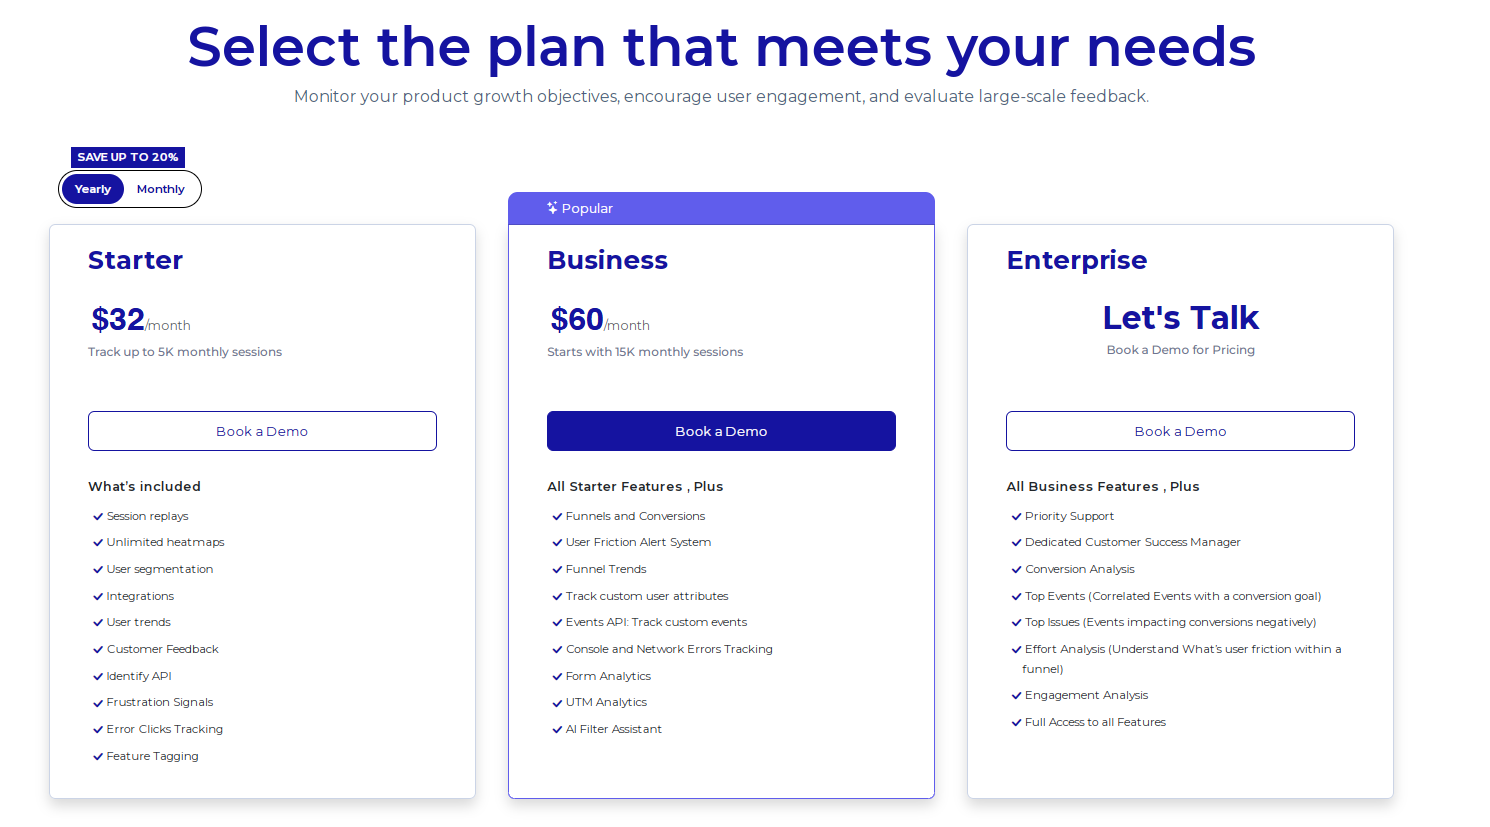
FullSession is easy and affordable for businesses of all sizes, from small startups to big enterprises. You can start a free trial before committing to a paid plan.
When you’re ready to subscribe, choose one of the three paid plans: Starter, Business and Enterprise. The Starter plan is just $39/month and includes all the essentials: unlimited heatmaps and session recording up to 5,000 sessions per month.
As your business grows and your needs change, you can easily upgrade to higher-tier plans. It means you only pay for what you need at each growth stage.
To get the most value, consider opting for an annual subscription, which gives you 20% off all plans.
Go to the Pricing page to see the plans in more detail and choose the one that suits your current needs and budget. You can start improving your customer journey analytics and user experience now.
Improve Your Website Performance
Learn how to detect and fix website issues before they affect your customer experience.
How to Boost User Experience With Customer Journey Analytics
Improving user experience means identifying pain points, personalizing interactions and optimizing touchpoints. Here’s how.
Identify pain points
Analyze customer interactions across multiple channels to pinpoint where users face challenges. Use customer feedback platforms to gather insights. Focus on areas with high cart abandonment or dissatisfaction and streamline processes to reduce friction in the customer’s journey.
Personalize experiences
Use UX research tools to tailor content and offers to individual preferences. Send personalized emails or product recommendations based on user behavior. This approach helps provide personalized customer experiences, increases engagement and builds customer loyalty.
Optimize website design
Improve your website by using user behavior data. Use digital analytics tools to simplify navigation, speed up load times and make key information easily accessible. Use A/B testing to continually improve the user interface and experience.
Implement data-driven marketing
Use marketing analytics tools and create marketing campaigns based on customer behavior insight. Segment your audience and time promotions to match buying patterns. Targeted campaigns on social media will increase customer interaction.
By completing these steps, you can create a smooth customer journey and meet their expectations.
Using Journey Analytics for Data-Driven Decision Making
Customer analytics can help you pinpoint issues in real time and improve your business decisions. With customer journey analytics, you can get actionable insights into customer behaviors and preferences to develop strategies that match customer expectations and improve your business outcomes.
With understanding the end-to-end customer journey and improving the overall customer experience, increased conversions are usually a natural byproduct.
Identify and track key performance indicators (KPIs) like customer retention rates, conversion rates, and customer satisfaction scores. Focusing on these KPIs helps you measure the success of your strategies and make necessary adjustments.
Integrating customer analytics with other business systems, such as CRM or ERP, improves data synergy and ensures a unified customer profile, leveraging diverse data sources for a deeper understanding of customer needs.
Using customer data platforms (CDPs) helps you aggregate data from various touch points and predict customer behavior. You can identify trends and patterns to develop effective marketing campaigns and improve customer experiences.
You can use customer journey analytics to foster data-driven decisions that support your business goals. Tracking these metrics and integrating data across platforms allows you to achieve practical insights that benefit your overall strategy.
Retention Strategies Driven By Customer Journey Analytics
Understanding why users leave, or customer churn analysis, is crucial. Using analytics, you can examine patterns and spot factors that may indicate a risk of losing customers.
For instance, a drop in engagement or frequent complaints could signal a potential problem. Tracking customer behavior over time reveals churn patterns, allowing you to identify these risk factors early and act before customers decide to leave.
Reducing friction in the customer journey decreases customer churn by ensuring a smooth experience at every touchpoint. With insights from customer behavior, you can create targeted campaigns to boost customer loyalty and retain customers. Personalized campaigns can prevent customer churn by addressing specific needs and preferences.
For example, if data shows a segment prefers discounts, consider offering personalized deals to entice them to stay and become loyal customers.
Identifying high-value customer interactions increases loyalty by focusing on moments that matter most to your customers. Analytics also help you evaluate how well your strategies work. You can see if your efforts are paying off by measuring key metrics like customer satisfaction or retention rates. If not, you can adjust your approach to better meet your customers’ needs.
Regular updates to customer engagement strategies help retain customers by aligning with their growing expectations. To keep new customers and reduce customer churn, be proactive.
Leveraging customer journey analytics helps you understand what makes your customers happy and address issues quickly. Retaining customers leads to a stronger business, turning satisfied clients into lifelong patrons.
Conclusion About Customer Journey Analytics
Customer journey analytics can help you understand why your customers make certain choices. Gathering data from different interactions lets you see patterns and preferences. This understanding enables you to make better decisions for your business.
By looking at the data, you can spot areas where customers might be having issues. Fixing these can improve their experience and satisfaction with your brand.
Customer journey analytics helps in understanding customer behavior and linking customer actions to business goals. It is important for improving your strategies.
You’ll be better equipped to meet customer needs and expectations by mapping out customer journeys clearly. It creates a seamless experience that can lead to greater customer loyalty.
FullSession helps you reach goals by providing an all-in-one user behavior analytics platform that equips you with all the tools you need to map customer journeys, collect key data, visualize and analyze all user interactions and optimize your website to meet their needs.
You can start a free trial or get a demo to learn more.
FAQs About Customer Journey Analytics
Let’s answer the most common questions about customer journey analytics.
What is customer journey analysis?
Customer journey analysis is the process of understanding how customers interact with your brand across multiple touchpoints. It’s about tracking and analyzing every step of the customer’s journey, from the first interaction to the final purchase, to improve their overall journey.
What is the difference between customer journey analytics and customer journey mapping?
Customer journey mapping visualizes the expected experience. Customer journey analytics measures the actual experience using data from real interactions.
How is customer journey analytics different from funnel analysis?
Funnel analysis measures progression through a defined conversion flow. Customer journey analytics is broader and looks at the full path users take across touchpoints, loops, delays, and drop-offs.
What metrics should you track in customer journey analytics?
Start with conversion rate by stage, drop-off rate, time to conversion, friction signals, segment differences, and retention or revenue indicators.
What tools are used for customer journey analytics?
Common tools include session replay, heatmaps, funnel analysis, feedback collection, and error tracking. The best combination depends on whether you are optimizing onboarding, checkout, lead generation, or retention.
How do you choose customer journey analytics software?
Look for software that helps you identify friction, segment behavior, analyze conversion paths, collect context, and turn insights into actionable improvements.
Mohamed oversees operations and finance at FullSession and has contributed to the company’s UX analytics knowledge base.