FullSession vs. Hotjar Heatmaps: Which Wins for SaaS? ...
Usability testing is critical for online businesses. If your website is complex, poorly structured, or malfunctioning, users may leave before engaging with your products or services.
Studies reveal that 61% of users will abandon a site if they can't find what they need within about five seconds. You must use web analytics tools to evaluate your website's performance and conduct usability testing studies to find areas for improvement.
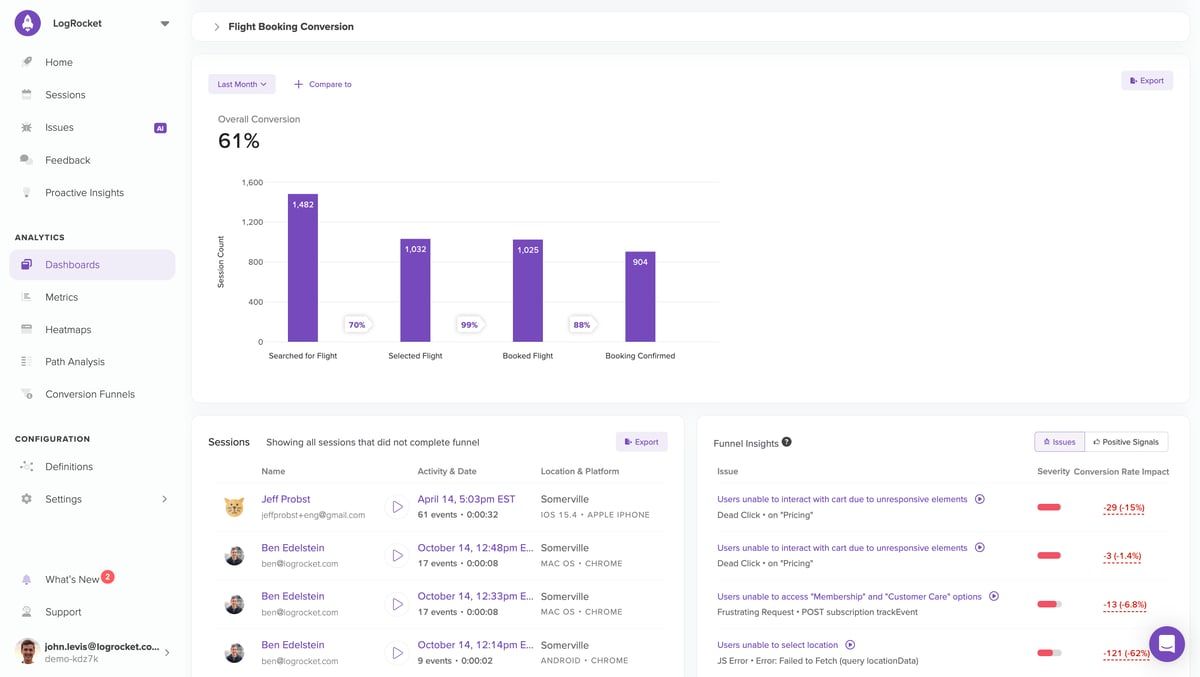
LogRocket is a popular tool for monitoring user sessions and debugging issues. However, its high learning curve, limited data retention, and unclear pricing often drive users to seek alternatives.
FullSession stands out as an excellent alternative to LogRocket. It provides user behavior analytics features, including session recordings, replays, interactive heatmaps, website feedback forms, advanced analytics, error analysis, and funnel and conversion optimization tools.
With FullSession, you can visualize all user engagement, analyze trends and patterns with laser precision, and optimize your website for peak performance.
Short on time?
Book a demo to see FullSession in action.
If you want to learn more about LogRocket competitors, continue reading our article. We will share feedback on the best alternatives to LogRocket to help you find the optimal solution for your business.
Key Takeaways
- LogRocket is a well-known frontend monitoring and analytics tool, but it comes with drawbacks like a steep learning curve, limited data retention, and complex pricing, prompting users to explore alternative options.
- FullSession provides a 360-degree view of user behavior data in a single, intuitive dashboard. You can capture all user interactions, analyze trends and patterns with laser precision and optimize your website for peak performance. FullSession allows for dynamic elements tracking, speeds up heatmap processing and helps you efficiently manage extensive data without affecting your site performance. It protects user privacy and limits monitoring to your site to prevent data misuse. It also facilitates cross-team collaboration. Book a demo to see how it works.
- Dynatrace provides infrastructure monitoring, security management, and business analytics. It offers a wide range of features, including real user monitoring, synthetic monitoring, and cloud automation, ideal for large enterprises with complex needs.
- Datadog combines application performance monitoring, log management, and real-user monitoring. It’s suitable for developers, cybersecurity specialists, and IT operations teams that need a unified platform.
- Lucky Orange focuses on tracking user behavior and optimizing conversion funnels. It includes features like session recordings, dynamic heatmaps, form analytics, and live chats, which makes it a good choice for marketers and user experience researchers.
- FullStory provides tools for analyzing user behavior, including session replays, heatmaps, and journey mapping. It’s designed for product managers, marketers, and UX researchers who need in-depth insights into user interactions and conversion rates.
Start a Free Trial to Experience FullSession
Capture all user interactions, spot trends and patterns and drive improvements without compromising your website performance.
5 Best LogRocket Alternatives in 2024
If you’re looking for the right web analytics tool, here are some of the most popular LogRocket competitors you can use to uncover hidden customer behaviors and visitor motivation.
1. FullSession
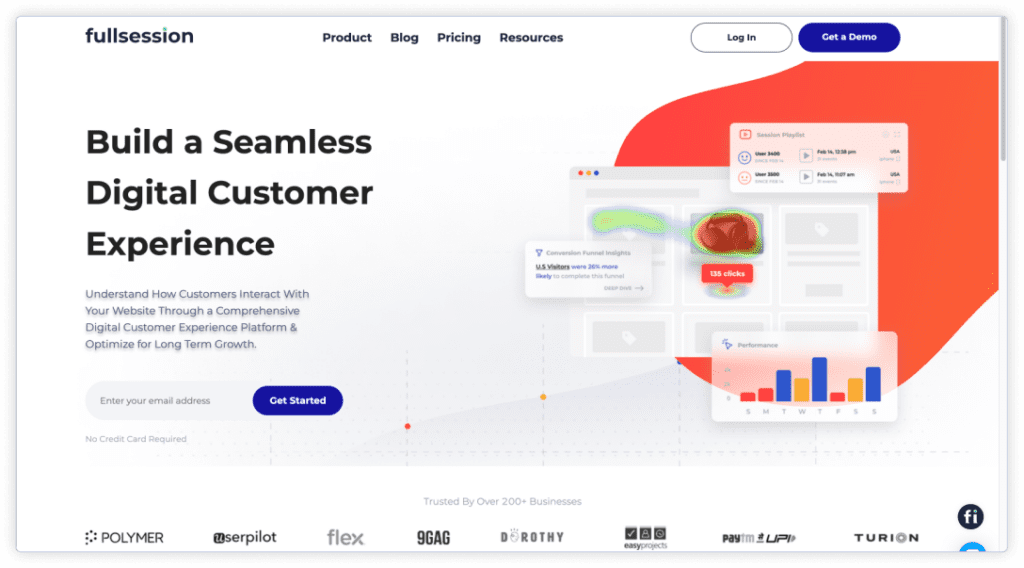
FullSession is user behavior analytics software that provides a 360-degree view of user behavior data in a single, intuitive dashboard.
It allows you to capture all user interactions in the customer journey, get visual insights instead of raw data, analyze trends and patterns in visitor behavior data, solve issues affecting user experience, and improve the performance of your website, landing page, or web app.
You can seamlessly share these insights across teams and departments.
Our user behavior analytics also complies with GDPR, CCPA, and PCI standards, protecting your data.
Start a free trial today.
User rating
FullSession has a 5 out of 5 rating on G2.
Who uses it?
FullSession is an excellent tool for web analysts, web designers, product teams, marketers, UX/UI researchers, analytics teams, and product managers. It can be valuable for most business owners in the SaaS (Software As A Service) and eCommerce sectors.
Deployment
To use FullSession, you just need to start your 14-day free trial and install a code snippet on your website.
We offer detailed guides to show you how to integrate FullSession with popular platforms such as WordPress, BigCommerce, Wix, and Shopify. You can also request a demo to see how it works.
Features list
Let’s explain the key features and benefits of FullSession.
1. Session recordings and replays
Session recording and replay allow you to track website visitors in real time, see how they interact with your site, and identify issues in their journey. You can also analyze user trends and see top users and referrers.
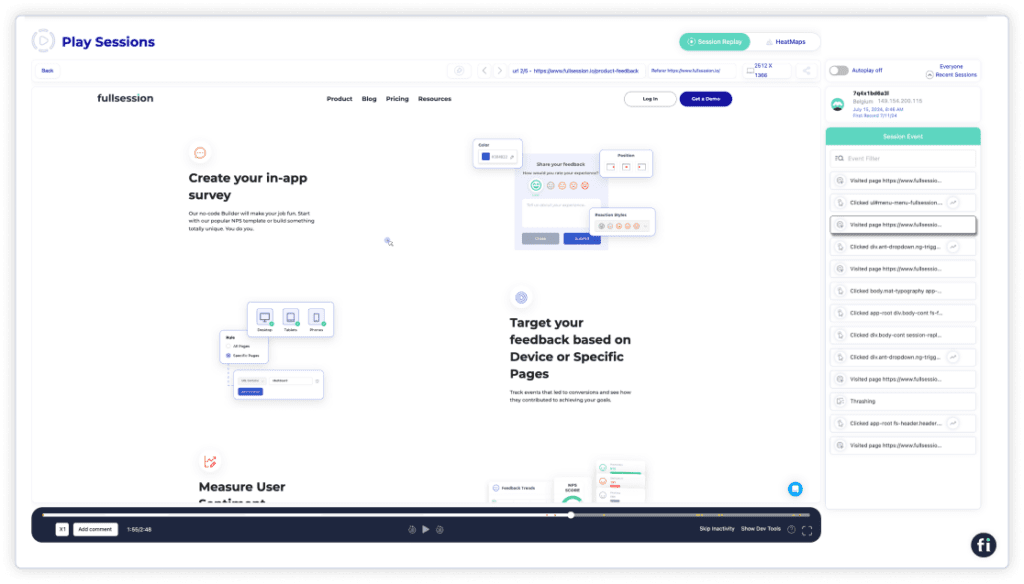
FullSession allows you to automatically record user activity, including error and rage clicks, and get data regarding user location, IP address, the visited URL, console logs, referrals, time spent on the page, session list, and session events.
With real user sessions, you can identify funnel drop-offs and observe customer actions, such as button clicks, hovers, scrolls, and mouse movement. You can skip the inactivity or speed up the session replay to focus on the critical user behavior.
2. Interactive heatmaps
Interactive heatmaps let you track mouse movements, see how far users scroll your web pages, and which page elements they engage the most or completely ignore.
When you sign up for the Basic plan, you can create unlimited heatmaps to observe how real users interact with your website.
Click map example

A click map is a heatmap visually representing users’ clicks on a web page. It helps you pinpoint where visitors are clicking the most, where they might be having trouble finding what they are looking for, and their overall engagement with your page elements.
You can see the URL of the visited page, the number of total visitors, views, and clicks, as well as errors, rage, and dead clicks. You can also see information regarding load time and average time on the page.
Improve Your Website UX and UI
Learn how our interactive heat maps help you find cold spots and dead zones on your site.
Mouse movement map example
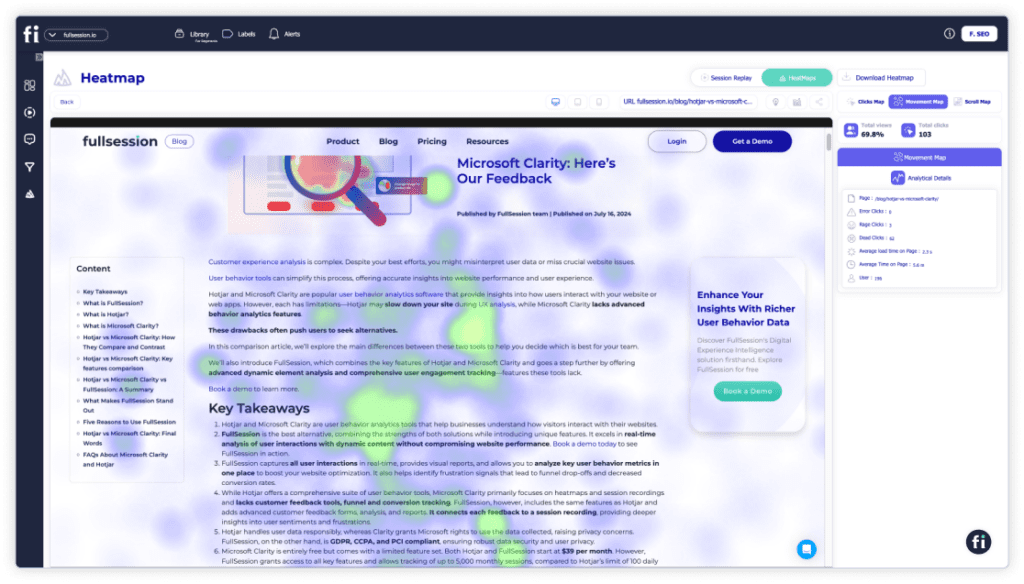
Using a mouse movement map, you can track users and visualize how they interact with your website, how interesting certain page sections are, and whether or not they find what they are looking for before exiting.
Scroll map example
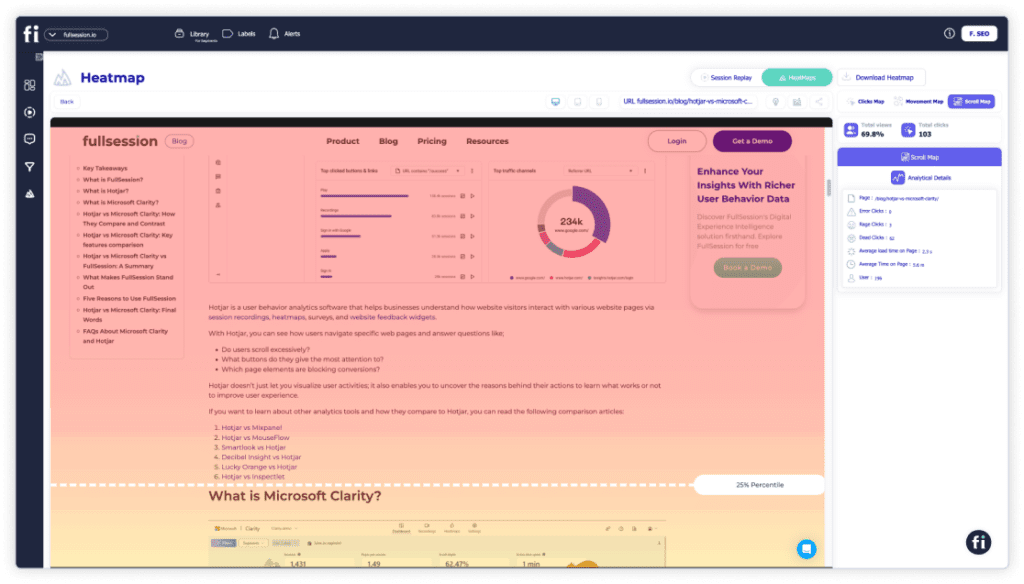
A scroll heatmap visually represents the user’s scroll behavior. It shows which parts of the page users view most often, which parts get the least attention, and where users spend the most time on each particular page.
3. User and event segmentation
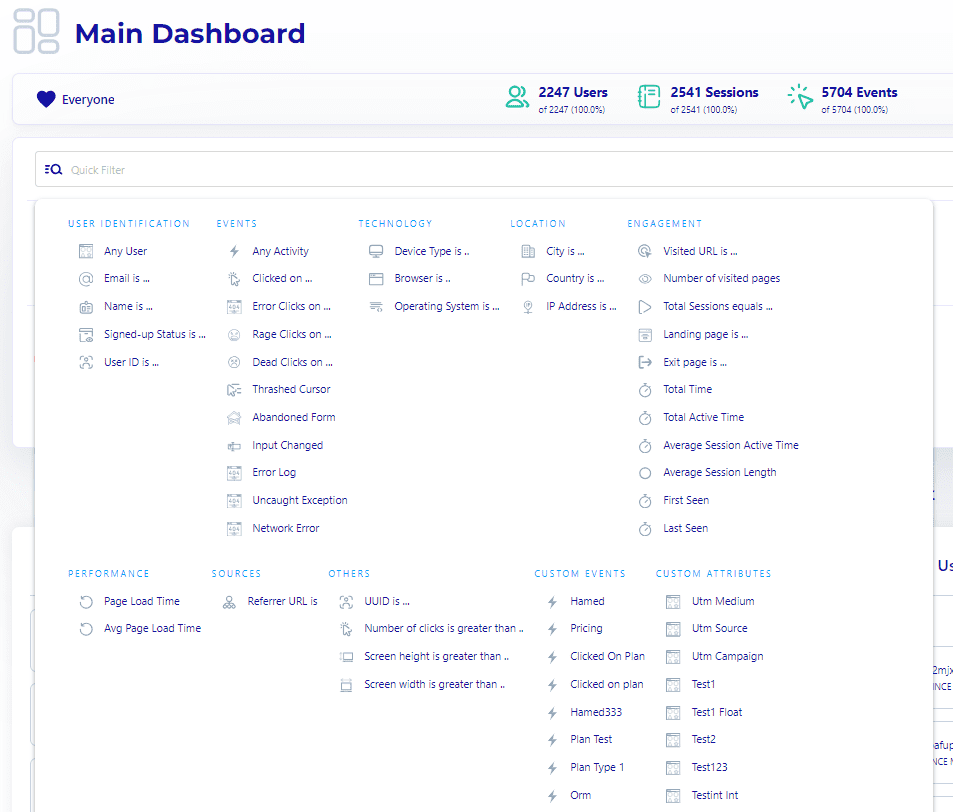
Customer segmentation helps you find critical events during a session. You can filter session recordings by various parameters and share your findings with the rest of your team. You can filter data for web browsers and mobile apps.
4. Customer feedback
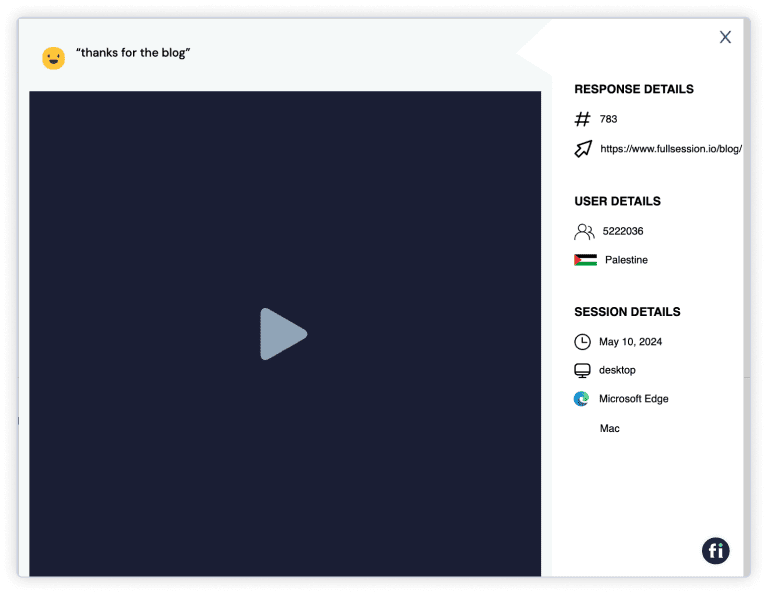
You can create customer feedback forms with a custom design and specific questions you want to ask your users. You can also choose which devices to collect user feedback on. You will get a detailed overview of each feedback, and you can send the results directly to your mailbox.
With these qualitative insights, you know exactly what you need to do to upgrade your key flows and conduct conversion rate optimization effectively.

Each user feedback is connected to a session recording, which you can watch to learn what happened and better understand your users.
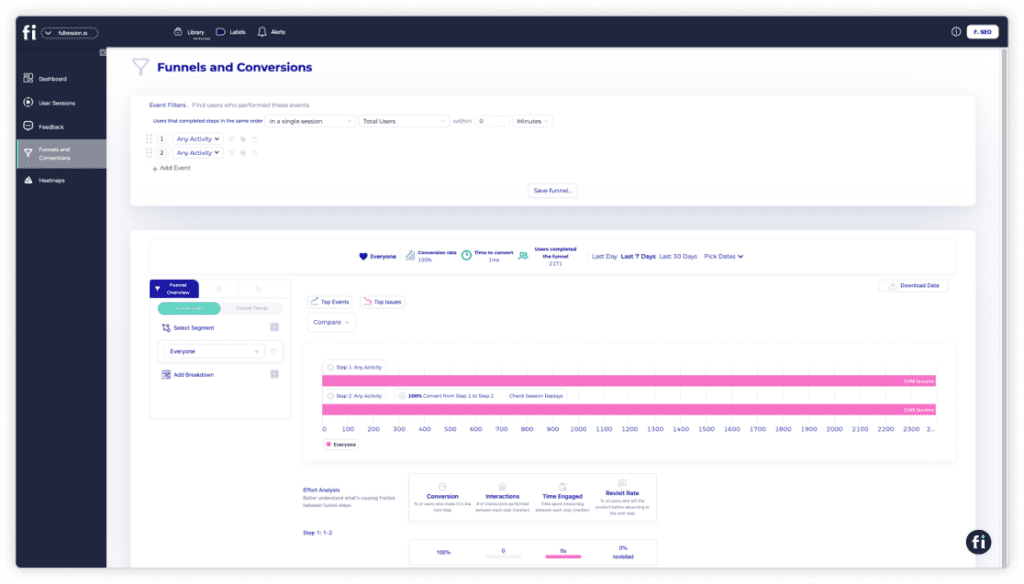
5. Funnel analysis
This feature allows you to track important conversion metrics such as the percentage of converted users, conversion rates, time to convert, etc. You can use this information to analyze the effectiveness of your marketing or sales funnels and optimize your strategy.
6. Error analysis
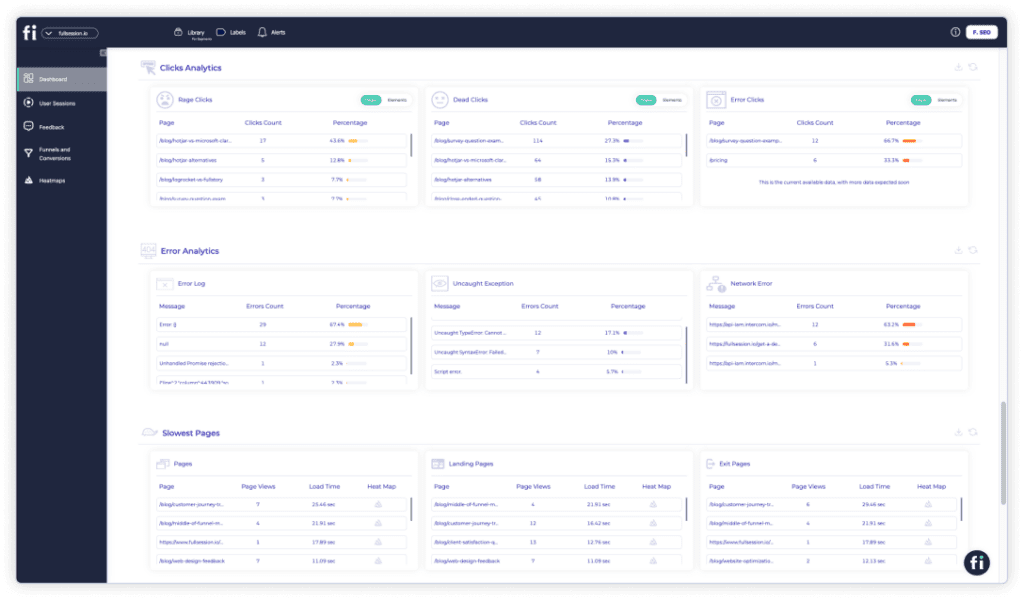
The bug tracking and error monitoring feature lets you analyze technical data that may affect digital experiences, such as:
- Error clicks
- Network activity errors
- Console errors
- Error logs
- Uncaught exception
With this comprehensive view of various types of errors, you can identify bugs and generate bug reports to improve the reliability of your digital products. Plus, you can formulate data-based actions that will help improve user satisfaction and get you more conversions.
What makes this tool unique
FullSession is a comprehensive web analytics platform that can help you:
- Track dynamic elements in real time for detailed insights
- Speed up heatmap processing without impacting site performance
- Prioritize user privacy by excluding sensitive data from recordings
- Efficiently manage large data sets to quickly discover essential insights
- Restrict user behavior tracking to your site to avoid data misuse
- Centralize team efforts and boost collaboration on one platform
It also allows you to provide the best customer experience and use valuable data to make continuous product improvements.
Integrations
You can integrate FullSession with third-party tools such as WordPress, Shopify, Wix, and BigCommerce, Open APIs and modern webhooks.
Customer support
FullSession provides detailed guides. You can also contact our team using the live chat or visit our help center.
Pricing
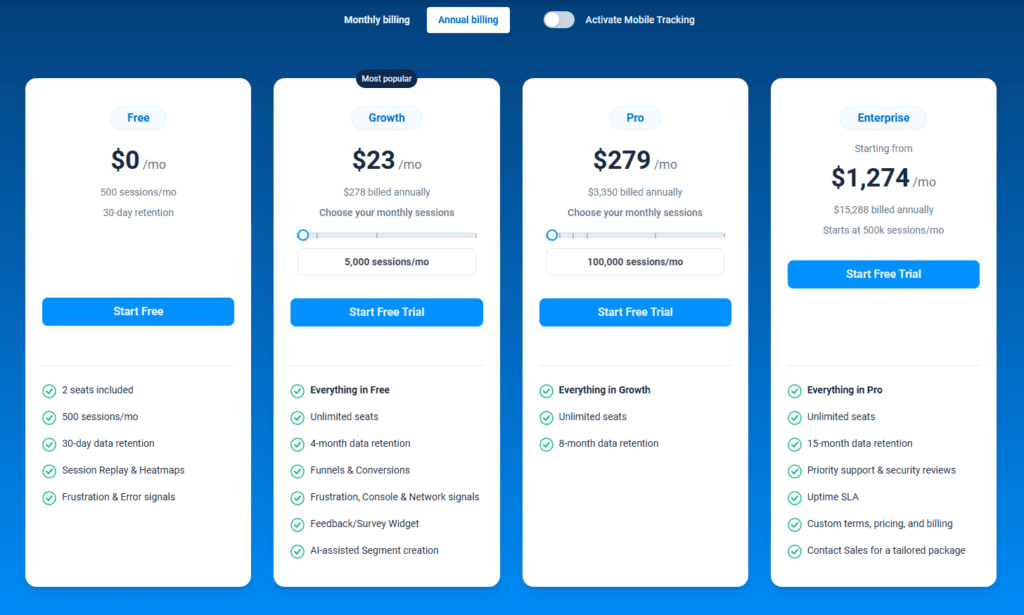
Here are more details on each plan.
- The Free plan is available at $0/month and lets you track up to 500 sessions per month with 30 days of data retention, making it ideal for testing core features like session replay, heatmaps, and frustration signals.
- The Growth Plan starts from $23/month (billed annually, $276/year) for 5,000 sessions/month – with flexible tiers up to 50,000 sessions/month. Includes 4 months of data retention plus advanced features like funnels & conversion analysis, feedback widgets, and AI-assisted segment creation.
- The Pro Plan starts from $279/month (billed annually, $3,350/year) for 100,000 sessions/month – with flexible tiers up to 750,000 sessions/month. It includes everything in the Growth plan, plus unlimited seats and 8-month data retention for larger teams that need deeper historical insights.
- The Enterprise plan starts from $1,274/month when billed annually ($15,288/year) and is designed for large-scale needs with 500,000+ sessions per month, 15 months of data retention, priority support, uptime SLA, security reviews, and fully customized pricing and terms.
Pros
- Captures and shows real-time user interactions
- Includes all user behavior tools to analyze and optimize user journeys
- It’s intuitive and easy to use
- It provides a 14-day free trial
- Offers detailed data regarding user behavior and engagement
- Advanced filtering options help you find what you’re looking for faster
- It doesn’t affect website performance or site speed negatively
- It can help you conduct A/B testing
Visualize, Analyze, and Optimize with FullSession
See how to transform user data into actionable insights for peak website performance.
2. Dynatrace
Image source: G2
Dynatrace is a software observability platform for infrastructure monitoring, security management, and business analytics. It offers many different features in one package, and you can use it to track various performance metrics, user experience, and behavioral data, among other things.
User rating
Dynatrace has a 4.5 rating on Capterra and a 4.5 score on G2.
Who uses it?
Different teams can use Dynatrace. It’s a good solution for financial markets, retail businesses, transportation companies, emergency services, and government.
Deployment
Dynatrace requires you to set up an account and install a client on the system you will use it on. This process is more complex than that of other platforms.
Features list
- Real user monitoring: You can view session replays to see how users interact with a page
- Synthetic monitoring: It helps you automatically find problems with your solution before users notice them
- Mobile app monitoring: You can use Dynatrace with mobile apps
- Business Analytics: You can track various business metrics, evaluate conversion rates, etc.
- Cloud automation: It helps accelerate software delivery
What makes this tool unique
Dynatrace offers many different features in one package and gives access to all the acquired data through a single dashboard. It can be beneficial for big companies that focus on cross-team collaboration.
Integrations
Dynatrace’s list of integrations is long. It mentions over 650 technologies, including AWS, GCP, Microsoft Azure, Kubernetes, and many others.
Customer support
Dynatrace offers a detailed help page. You can contact the company via phone or email.
Pricing

The pricing depends on the features and services you want to use. Here's the hourly and per-item pricing breakdown:
- Full-stack monitoring: $0.08 per hour for 8GB host
- Infrastructure monitoring: $0.04 per hour on any size host
- Kubernetes monitoring: $0.002 per hour for any size pod
- Application security: $0.018 per hour for 8GB host
- Real user monitoring: $0.00255 per session
- Synthetic monitoring: $0.001 per synthetic request
- Log management and analytics: Starts at $0.20 per GiB
Pros
- Dynatrace offers many different features in one place
- You can use the platform as a SaaS or deploy it in your cloud environment
Cons
- User experience isn’t the focus here, and some companies won’t need so many features
- Compared to other tools, deployment is more complex
- It has a high learning curve
- Confusing pricing
3. Datadog
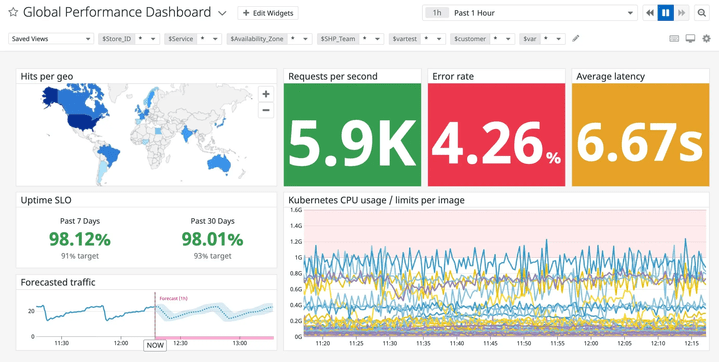
Image source: G2
Datadog provides cloud monitoring as a service. It allows businesses to monitor their websites and apps and manage security concerns. It offers multiple components and features in one product, including application performance monitoring, performance management, and real user monitoring.
User rating
Datadog has a 4.6 rating on Capterra. The tool’s score on G2 is lower – 4.4.
Who uses it?
Developers, cybersecurity specialists, IT operations teams, and business users can use Datadog in their workflow.
Deployment
You must set up an account and install a client. It’s not a complicated process, but it’s not as easy as installing the FullSession code snippet.
Features list
- Log management and interactive dashboards: Datadog unifies logs and metrics and shows everything in one place
- Session replay and real user monitoring: You can see what users do on the page
- Synthetic monitoring: End-to-end testing during the entire development process
- Error tracking: Datadog automatically flags problematic sessions
- Privacy controls: Privacy options to anonymize sensitive information
What makes this tool unique
Datadog offers many features under one umbrella. You can track many applications and pages simultaneously and access data regarding performance, security, user experience, etc. It can be a good option for corporations that prefer one system to deal with various issues.
Integrations
You can integrate Datadog with over 750 technologies, including AWS, Apache, Microsoft Azure, GitHub, GCP, and Jenkins.
Customer support
Datadog offers a help page and documentation. You can contact the company via phone, e-mail, or live chat.
Pricing
Datadog offers different pricing options with several plans for each service. For example, infrastructure monitoring has a Pro plan and an Enterprise plan. The first one costs $15/host/month, and the second one costs $23/host/month.
Real user monitoring and session replay cost $1.50 per 1,000 sessions per month on browsers and mobile devices. The Browser Premium Plan with additional features is priced at $1.80 per 1,000 sessions per month.
Pros
- A complex platform that lets you monitor various metrics at the same time
- You can use it in many different systems and environments
- It takes privacy into account
Cons
- The platform offers much more than just user experience monitoring, but many companies won’t need such an extensive feature set
- Deployment is more complex than in the LogRocket case
- Confusing pricing
4. Lucky Orange
Image source: G2
Lucky Orange provides a comprehensive suite of conversion optimization tools. It lets you track user behavior, watch how users interact with your website, and optimize their experiences to improve conversion rates.
It also allows you to analyze incoming traffic and identify what causes funnel drop-offs.
User rating
Lucky Orange has a 4.7 rating on Capterra and a slightly lower 4.6 score on G2.
Who uses it?
Lucky Orange was designed for user experience researchers, marketers, and members of support teams.
Deployment
To use Lucky Orange, you must install a code snippet on your website. It’s relatively easy – you don’t need any actual coding knowledge.
Features list
- Session recordings: Help you watch users interacting with your website
- Dynamic heatmaps: See which parts of the page people click on and what they avoid
- Dashboard insights: Lucky Orange offers a range of useful insights, including information on funnel behavior, event completions, and traffic
- Form analytics: You can find out why people leave your forms
- Conversion funnels: See at what points and moments users abandon your site
- Visitor profiles: Each profile serves as a log that shows the interactions of a user with the solution
- Surveys: Ask your users questions with customizable survey questions
- Announcements: Share important news with your audience
- Live chats: Use them to provide customer support
What makes this tool unique
Lucky Orange is a real-time UX analysis tool that focuses on optimizing conversion funnels. Depending on the subscription plan, data retention is 30-60 days. Thanks to a flexible pricing system, you can easily scale the service as your business grows.
Integrations
You can integrate Lucky Orange with WordPress, Google Tag Manager, Shopify Plus, BigCommerce, Magento, etc.
Customer support
Lucky Orange has a dedicated support site. You can also contact the company via chat.
Pricing
Lucky Orange offers five pricing plans:
- Free: Lets you record up to 100 monthly sessions.
- Build: $39 per month for up to 5,000 monthly sessions.
- Grow: $79 per month for up to 15,000 monthly sessions
- Expand: $179 per month for up to 45,000 monthly sessions
- Scale: $749 per month for up to 300,000 monthly sessions
Pros
- It’s easy to install
- It offers plenty of data
- Good for optimizing conversion funnels
Cons
- Some users complain of sites’ slow load times
- It has a high learning curve
- There are reports of missing or inaccurate data
5. FullStory
Image source: G2
FullStory is a behavioral data platform that gives teams plenty of tools to analyze user behavior. It tracks mouse movement, scrolling, and clicking, as well as form filling. It also provides access to heatmaps and session replays, which you can use to optimize funnels and conversion rates.
Learn more: Hotjar vs FullStory.
User rating
FullStory has a 4.7 rating on Capterra. The score on G2 is a bit lower – 4.6.
Who uses it?
FullStory is a platform for product managers, marketers, and UX/CX researchers.
Deployment
To use FullStory, you must install a code snippet on your website. The company provides tutorials to make the process easier.
Features list
- Privacy protection: The solution doesn’t collect sensitive data
- Heatmaps: They help you track user behavior
- Session replays: Record user sessions and see what your users are doing
- Tagless auto-capture: It allows you to retroactively capture what your users see and get an insight into their experience
- Frustration signals: Automatic alerts that help you identify problems, causes for rage clicks, etc.
- Funnels and conversions: You can check how users use your website and whether it works as intended
- Journey maps: This feature shows how users navigate your website
- Dashboard: Easy access to key data and metrics
What makes this tool unique
FullStory is a comprehensive UX intelligence platform that offers access to in-depth data regarding customer behavior, funnels, and conversion rates.
You can access all the critical information through a detailed dashboard, and the company ensures that users’ privacy is not disturbed. However, the tool is complex and can be challenging to learn.
Integrations
You can integrate FullStory with BigCommerce, Magento, Shopify, Squarespace, WooCommerce, Google Tag Manager, and Segment.
Customer support
FullStory has a dedicated help page. You can also contact the company via email.
Pricing
FullStory has a free plan that should cover the basic needs of smaller businesses. There are also two paid plans – Business and Enterprise – with some differences in terms of offered features. However, the exact pricing isn’t specified on the website.
Pros
- Easy to install
- Allows accurate tracking of the user’s journey on your website and helps you identify potential problems with UX
- You can share session recordings
- Focus on privacy
Cons
- Basic pricing information isn’t available on the website, and some users don’t like the way subscription plans are set up – charging is per session, not unique users
- It’s not the easiest of solutions to use – learning it and getting to the data you need may require a time investment
LogRocket Competitors: A Short Overview
Here’s a short overview with some details regarding all of the five compared platforms in the form of a handy table.
| Key features | Best for | Languages | Support | Pricing | Free trial or version | |
| FullSession | Session recordings, heatmaps, feedback tools, funnels and conversions, error analysis | eCommerce and SaaS businesses | English, French and Arabic | Help center, e-mail | Starting at $32/month for 5,000 monthly sessions | Yes |
| Dynatrace | Real-time user monitoring, synthetic monitoring, cloud automation | Large enterprises | English | Help center, e-mail, phone | $0.08 per hour for 8GB host | Yes, trial |
| Datadog | APM, log management and analytics, session replay | Businesses that want to prioritize security and UX across multiple systems | English, Spanish, Italian, French, Japanese, Korean | Help page, e-mail, phone, chat | $15/month | Yes, trial |
| Lucky Orange | Session recordings, heatmaps, conversion funnels | Marketers and UX researchers | English | Support site, chat | Starting at $39/month | Yes – both trial and version |
| FullStory | Session replays, tagless auto-capture, frustration signal detection | Product managers and UX researchers | English | Help page, e-mail | Unknown | Yes – both trial and version |
You can also read our comparisons of Mouseflow vs VWO, Hotjar vs Microsoft Clarity, LogRocket vs FullStory, and more.
LogRocket Competitors: The Verdict
If a product offers a bad experience, people won’t use or pay for it. For this reason, you must ensure your solution provides the best user experience and test it extensively. It’s pretty much the only way to find and fix usability problems.
To do this effectively, regularly, and on a large enough scale, you must invest in specialized web analytics tools, such as FullSession.
This powerful tool offers a range of valuable features, such as session recordings, interactive heatmaps, customer feedback forms, funnels and conversions, and error analysis.
Whatever features you may need to find issues with your product – we have it!
With FullSession, you can:
- Monitor dynamic elements in real time for accurate user insights
- Speed up heatmap processing without affecting site performance
- Ensure user privacy by not recording sensitive data
- Efficiently handle large data sets to uncover essential insights quickly
- Restrict user behavior tracking on your website to prevent data misuse
- Enhance cross-team collaboration and centralize efforts on a single platform
However, you don’t have to take us at our word – you can book a demo today and see it for yourself!
FullSession Pricing Plans
The FullSession platform offers a 14-day free trial. It provides three paid plans—Starter, Business, and Enterprise. Here are more details on each plan.
- The Starter plan costs $39/month or $32/year and allows you to monitor up to 5,000 monthly sessions.
- The Business plan costs $75/month or $60/year and helps you to track and analyze up to 100,000 monthly sessions.
- The Enterprise plan has custom pricing and offers customizable sessions plus full access to all features.
Book a demo today to learn more!
FAQs about LogRocket Competitors
Let's answer the most common questions about LogRocket competitors.
What is LogRocket?
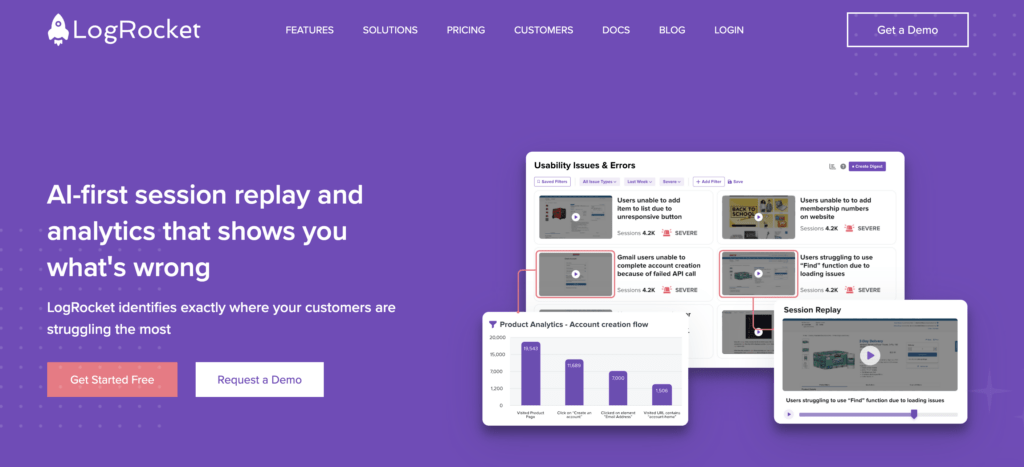
LogRocket is a frontend monitoring and analytics tool that provides session replay, error tracking, and performance monitoring features.
This platform is suitable for development, product, design, and support teams, and you can use it to improve web and mobile applications. It helps you optimize conversion rates and boost customer engagement.
How does LogRocket work?
LogRocket requires you to install a code snippet or a plugin on your website. It allows you to watch session replays, monitor front-end performance in real time, track errors and various UX metrics, and analyze the acquired data.
What are LogRocket pros?
- It’s a solid session recording tool
- It’s GDPR- and CCPA-compliant
- There’s a hosted solution, but you can also use LogRocket in your cloud environment
What are LogRocket cons?
- The user interface isn’t top-notch
- A high learning curve can be time-consuming
- It can be difficult to use for some users
- Paid plans can get expensive as your business grows
What is LogRocket pricing?
LogRocket has four pricing plans with different numbers of sessions and features. Here's the pricing breakdown for web analytics features:
- Free: Up to 1,000 sessions per month and one-month data retention
- Team: $99 per month for 10,000 sessions per month and up to one-month data retention
- Professional: $350 per month for 10,000 sessions per month, advanced filters and issues, and detailed product analytics
- Enterprise: Customizable plan for large enterprises
There’s also a 14-day free trial for all plans.
What are some common alternatives to LogRocket?
Popular alternatives to LogRocket include FullSession, Mouseflow, FullStory, Hotjar alternatives, Mixpanel, Dynatrace, and Lucky Orange. These tools offer various features for web analytics, session replay, user behavior tracking, and more.
How do LogRocket competitors differ in terms of pricing?
Pricing varies significantly among LogRocket competitors. For instance, FullSession offers a free trial and affordable premium plans, starting at $39/month for the Starter plan.
What unique features do some LogRocket competitors offer?
Each competitor offers unique features. FullSession stands out with its intuitive interface, session recordings, interactive heatmaps, and advanced analytics. It also provides user feedback forms and detailed error analysis.
