Struggling to understand why visitors leave pages without converting? UX heatmap tools give you a concrete answer fast. They turn raw click and scroll activity into color-coded visual maps overlaid on your actual pages, so you can see exactly what’s working and what’s quietly costing you revenue.
The problem is that most tools in this category look identical on the surface but behave very differently once you’re actually using them.
Some don’t let non-technical users in without serious training. Others need manual event setup before they’ll capture anything meaningful. A few advertise a low price and hide the features you actually need behind a higher tier.
This guide walks through seven of the best UX heatmap tools available today with an honest look at what each one does well and where it falls short.
Key Takeaways
- FullSession: All-in-one platform with session replay, heatmaps, funnels, error tracking, and Lift AI prioritization built in, so your team never has to stitch tools together or guess what to fix next.
- FullStory: Powerful autocapture and retroactive analytics make it a strong fit for enterprise teams, but the lack of public pricing and a demanding onboarding process put it out of reach for most mid-market teams.
- Hotjar: The go-to for lightweight UX research with built-in surveys and feedback widgets, though it covers web only and data retention limits on lower plans can become a real constraint.
- Microsoft Clarity: The only genuinely free heatmap tool with no session caps, making it a solid starting point for small teams, but it lacks funnels, form analytics, and any kind of mobile coverage.
- Smartlook: A good choice for cross-platform teams that need native mobile SDK support and the ability to retroactively filter historical session data without waiting for new recordings.
- Mouseflow: Offers more heatmap types than any other tool on this list, including friction scoring and geo heatmaps, but it’s strictly web-only with no AI prioritization.
- Contentsquare: Enterprise-grade revenue attribution at the page element level is genuinely unique, but the price point, steep learning curve, and lack of self-serve access rule it out for most teams.
Most tools on this list do one or two things well. FullSession does all of it in one place: heatmaps, session replay, funnels, error detection, mobile analytics, and Lift AI, which tells you not just what’s broken, but which fix will have the biggest revenue impact.
You get complete behavioral coverage without managing multiple subscriptions, and every feature is included from day one with no hidden tiers.
If you want to see how it works, book a demo.
What Is a UX Heatmap Tool?
A UX heatmap tool is behavioral analytics software that records how real users interact with your website or app and overlays that activity as a color-coded map directly on your pages. Red and orange zones mark high engagement. Blue areas show where visitors scroll past, ignore, or never reach at all.
That visual layer gives your team something raw dashboards can’t: an immediate, intuitive picture of how your page layout and content actually perform with real people under real conditions.
Most platforms offer several different map types:
- Click maps show where users click or tap, surfacing frustration signals like rage clicks on non-interactive elements
- Scroll maps reveal scroll depth and how far users scroll down the page before leaving
- Movement maps track cursor paths, which often correlate with reading attention
- Attention maps blend click and scroll signals to estimate where users focus the most
- Interaction maps capture how visitors interact with dynamic elements like modals, accordions, and dropdown menus
There’s an important distinction worth understanding upfront.
Heatmaps show aggregate patterns across all your visitors. Session replay lets you watch individual sessions reconstructed as a video to understand what happened during a specific visit. The best platforms give you both in one connected interface.
Read our guide to learn more about heatmaps vs session replays.
Why Teams Rely on UX Heatmap Tools
Standard web analytics platforms deliver quantitative metrics: page views, bounce rates, and traffic sources. What they can’t tell you is how real users interact with individual elements, which sections they focus on, and where user engagement drops before a conversion step.
Heatmap analytics closes that gap. The qualitative data these platforms show transforms abstract conversion problems into specific, visible issues your team can fix.
Here’s how teams typically put that data to work:
- Identify friction points in conversion flows before small issues compound into revenue problems
- Optimize page layout by repositioning CTAs and key content to where visitors actually look
- Understand user behavior patterns across devices, traffic segments, and visitor types
- Build A/B testing hypotheses grounded in what users actually do rather than what you assume
The combination of qualitative insights from heatmaps and quantitative data from your analytics platform gives your team the complete picture: what happened and why.
7 Best UX Heatmap Tools Compared: Quick Overview
Here’s how the seven leading options stack up at a glance.
| Tool | G2 Rating | Best For | Top Feature | Starting Price |
| FullSession | 5/5 | All-in-one behavioral analytics with advanced AI | Lift AI revenue-impact prioritization | $23/month (billed annually).Start a free trial. |
| FullStory | 4.5/5 | Enterprise digital experience analytics | Autocapture without requiring manual tagging | Custom pricing |
| Hotjar | 4.3/5 | Lightweight UX research + feedback | Heatmaps + surveys in one tool | $49/month via Contentsquare |
| Microsoft Clarity | 4.5/5 | Free heatmaps at unlimited scale | Unlimited heatmaps at no cost | Free |
| Smartlook | 4.6/5 | Cross-platform web and mobile analytics | Retroactive analytics + native mobile SDK | $55/month |
| Mouseflow | 4.6/5 | Widest heatmap type selection | Seven heatmap types including friction detection | $39/month |
| Contentsquare | 4.4/5 | Enterprise DX analytics at scale | Zone-based heatmaps with revenue attribution | $49/month |
The 7 Best UX Heatmap Tools in 2026
Now, let’s share more details about each solution on our list.
1. FullSession
FullSession is an all-in-one behavioral analytics platform that brings together session recording and replay, interactive heatmaps, conversion funnels, error monitoring, in-app feedback collection, and native mobile analytics for iOS and Android in a single connected dashboard.
It sits in the user behavior analytics category and is built for teams that need to move directly from observation to prioritized action.
What separates FullSession from every other tool on this list is Lift AI, its AI prioritization engine.
Rather than leaving your team to manually interpret heatmap data, Lift AI scans behavioral signals, ranks friction points by expected revenue impact, and links each finding to the specific recordings where the issue occurs.
You see the problem, evidence and fix impact in the same view.
Start a free trial to test the platform.
Best for
Product teams, growth marketers, and UX researchers at SaaS and e-commerce companies that need complete behavioral coverage across web and mobile apps without managing multiple subscriptions.
Key features
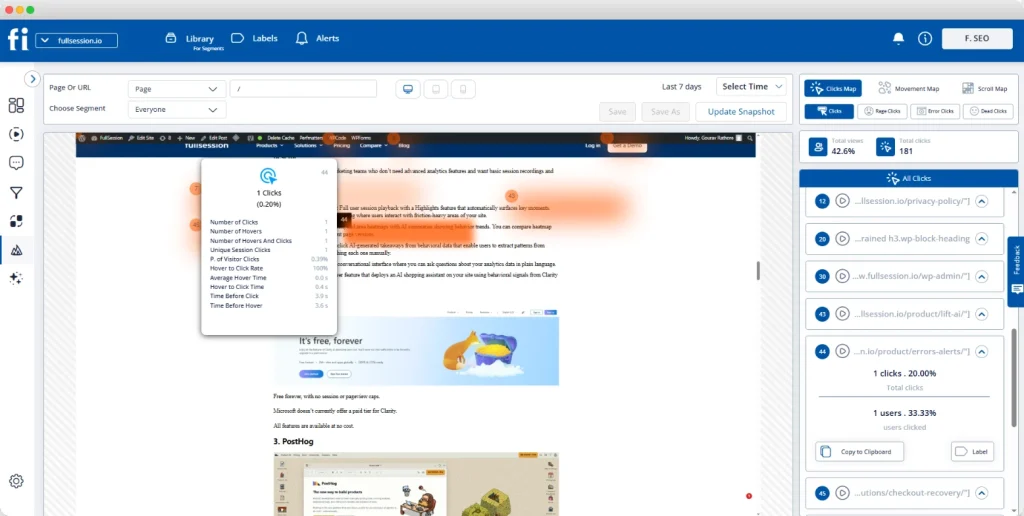
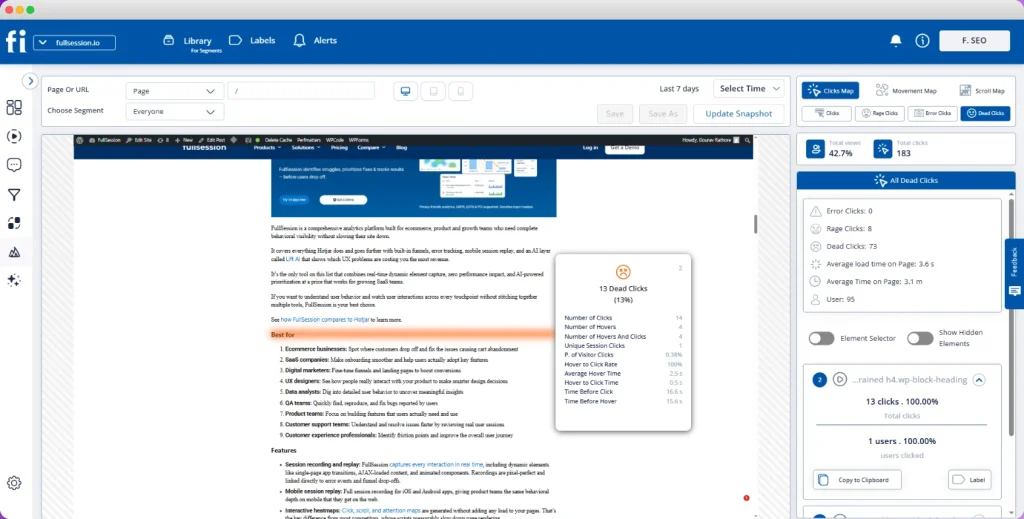
- Click, scroll, and movement heatmaps that update in real time and work natively across dynamic pages and single-page applications without additional setup
- The Play Sessions interface that gives your team instant access to full user sessions, with a timestamped events panel showing pages visited, user interactions with each element, and the complete navigation path taken
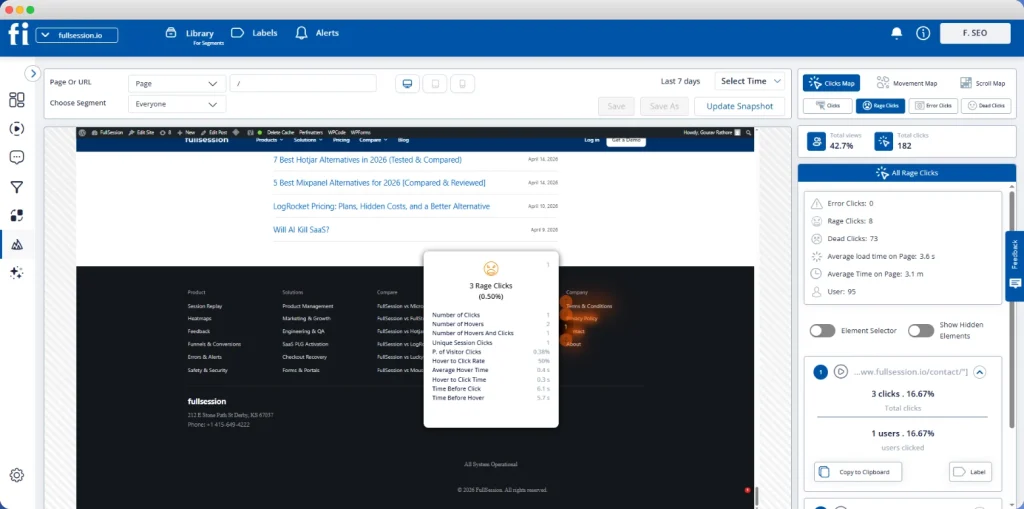
- Lift AI which scans behavioral data, ranks friction points by revenue impact, links each to the recordings where the issue occurs, and validates outcomes once you ship a fix
- Errors and alerts detects frustrated taps and JavaScript errors in real time so your team responds to broken flows before customers escalate to support
- Mobile session replay covers iOS and Android natively with the same behavioral fidelity as web, all within one subscription
- Funnel tracking to track drop-offs at every step and see what direclty blocks coversions
- GDPR, CCPA, and PCI DSS compliance is built in with default masking on sensitive form fields; no separate privacy modules required
- The asynchronous SDK architecture preserves website performance, leaving Core Web Vitals unaffected
Pricing
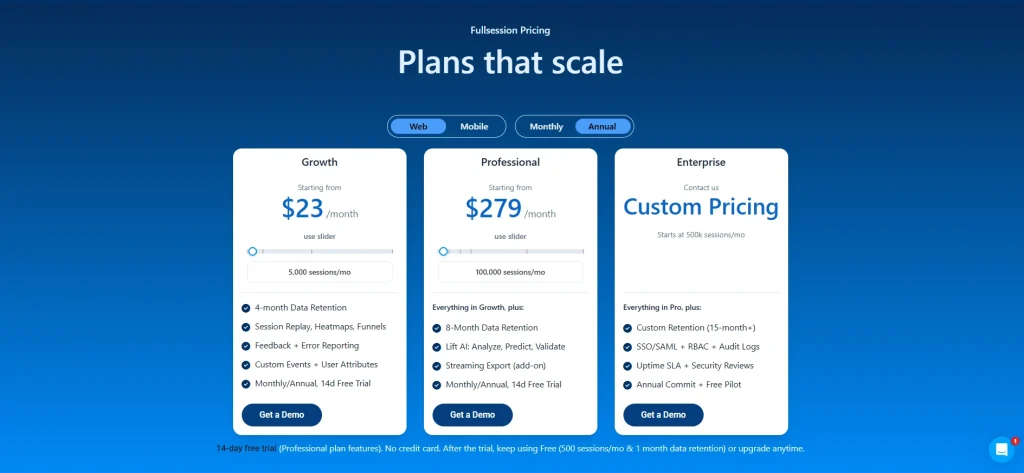
FullSession’s free plan covers 500 sessions per month with 30 days of data retention.
The Growth plan starts at $23/month, billed annually, for 5,000 sessions and includes all key features, 4-month data retention and unlimited seats.
The Professional plan starts at $279/month for 100,000 sessions with unlimited seats and 8-month data retention.
Custom pricing is also available with 15-month data retention.
Check out the pricing page to evaluate fit before any sales conversation.
A 30-minute call shows you exactly how heatmaps, session replay, and Lift AI work together. No commitment required.
Book a demo today.
2. FullStory
FullStory is a digital experience analytics platform that automatically captures every interaction without requiring manual tagging or pre-configured event schemas.
Its enterprise orientation puts it in a distinct category: it’s designed for large organizations that need autocapture at scale, compliance-grade privacy controls, and deep integrations with incident management workflows.
The retroactive depth is the key differentiator. Because FullStory records from the moment you install the script, you can answer behavioral questions that occurred to you months after launch. That historical coverage matters for enterprise teams rebuilding complex conversion flows.
- Learn more about FullStory competitors.
- See how FullSession compares to FullStory.
Best for
Large product and engineering teams that need autocapture at scale, deep integrations with Slack and Jira for incident workflows, and compliance controls for regulated industries.
Key features
- Autocapture records clicks, scrolls, taps, and form inputs across comprehensive session recordings without predefined event setup
- Frustration signals, including dead clicks are detected and surfaced automatically across all recorded visits
- Dynamic heatmaps visualize aggregate interaction patterns across pages with direct drill-down into individual recordings from any view
- Advanced segmentation capabilities filter visitor behavior by user attributes, session properties, and technical events simultaneously
- Data loss prevention and IP anonymization support regulatory requirements for financial services and healthcare
- Custom funnel analysis lets teams map and compare user paths without predefined schemas
Pricing
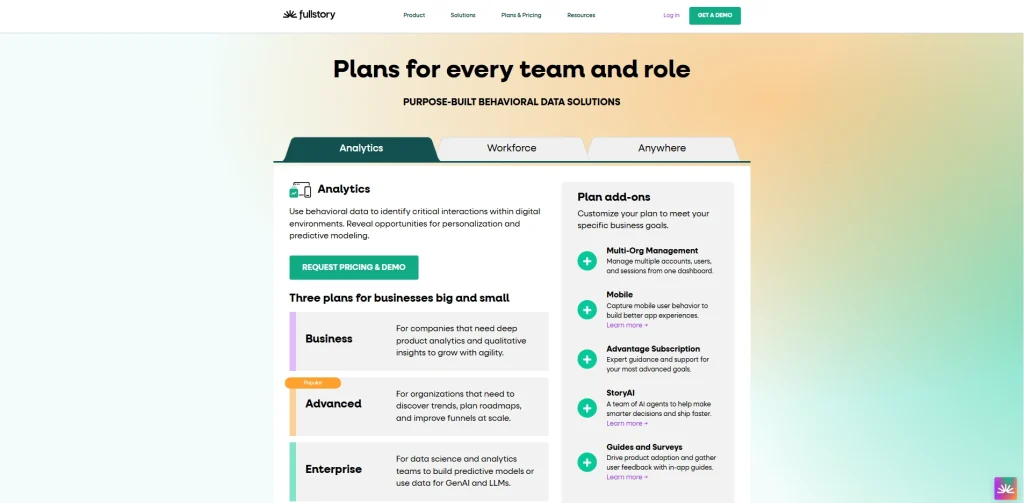
FullStory offers a limited free tier.
All subscriptions require contacting their sales team, and no public pricing is available, which makes early budget evaluation difficult.
The platform also requires meaningful onboarding before most teams can work independently.
3. Hotjar
Hotjar is a UX research tool and feedback platform that combines heatmaps, recorded sessions, and survey tools in one lightweight interface. Now part of Contentsquare, it’s one of the most widely adopted tools in this space, with fast setup and a large community of users and learning resources.
What distinguishes Hotjar from the others on this list is its ability to collect direct user feedback alongside behavioral observation.
Most website heatmap platforms show you what visitors do. Hotjar adds a structured layer for asking them why, with built-in surveys, NPS polls, and on-page widgets that connect directly to session data. However, Hotjar might also slow down your website.
- Learn more about Hotjar alternatives.
- Read more about Lucky Orange vs. Hotjar.
- See how Hotjar compares to FullSession.
Best for
Marketing and UX teams at small and mid-market companies that want fast setup, visual behavioral data, and voice-of-customer tools without building a complex analytics infrastructure.
Key features
- Click, scroll, and movement heatmaps across desktop, tablet, and mobile with device-level filtering
- Recordings with AI-generated summaries that highlight key moments automatically, reducing the time your team spends reviewing footage to track user behavior
- Conversion funnels show where visitor behavior breaks down at each step in a multi-page flow, with recordings accessible directly from any funnel stage
- Survey builder with 40-plus templates for capturing direct user feedback on specific pages, with AI-generated analysis of responses
- Form analytics capture field-level abandonment, time-per-field data, and completion rates by traffic segment
- Integrations with Google Analytics, HubSpot, Optimizely, and other tools your team already uses
Pricing
Hotjar’s free plan includes up to 200k monthly sessions.
Paid plans start at $49/month and scale by session count. Data is retained for 13 months on subscriptions. Hotjar is web-only and doesn’t support native mobile apps.
Teams working across web and mobile platforms need a different tool for in-app behavioral data.
4. Microsoft Clarity
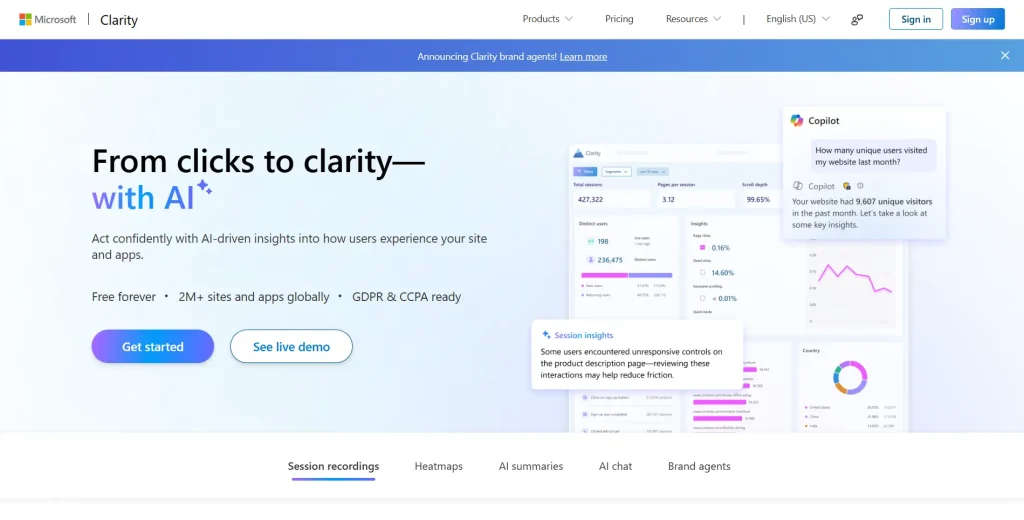
Microsoft Clarity is a free website heatmap and session recording tool that eliminates the cost for behavioral analytics entirely, with no session caps and no feature gating. It removes the barriers that make paid tools inaccessible for smaller teams or high-traffic sites.
The core proposition is simple: unlimited heatmaps with click and scroll data aggregated from every visit, no traffic thresholds or sampling applied.
However, it might not be the best fit if you need advanced features like custom event tracking, user segmentation, funnel analysis, API integrations, or exportable raw data.
- Learn more about Microsoft Clarity vs FullSession.
- See how Microsoft Clarity compares to Hotjar.
Best for
Individual developers, content teams, and small businesses already using Google Analytics or Google tag manager who need basic visual behavioral data added to their stack without any spend.
Key features
- Heatmap data captured across all pages from every visit, with no caps or sampling
- Captured sessions include rage click detection, dead click identification, and error logging by default
- Native Google Analytics 4 integration so you can view Clarity data alongside your existing quantitative metrics in one interface
- Google Tag Manager deployment requires no code changes, making setup accessible without developer involvement
- GDPR-compliant data handling with automatic masking of text inputs and IP addresses
- Co-browsing mode lets support teams review a user session alongside customers in real time
Pricing
Microsoft Clarity is completely free with no paid tier. Teams that need advanced filtering by user segment, in-depth form analytics, actual user sessions tied to conversion tracking, or mobile app behavioral data will need a paid platform.
The data retention period is 90 days, which rules it out for analysis that requires more than three months of history.
5. Smartlook
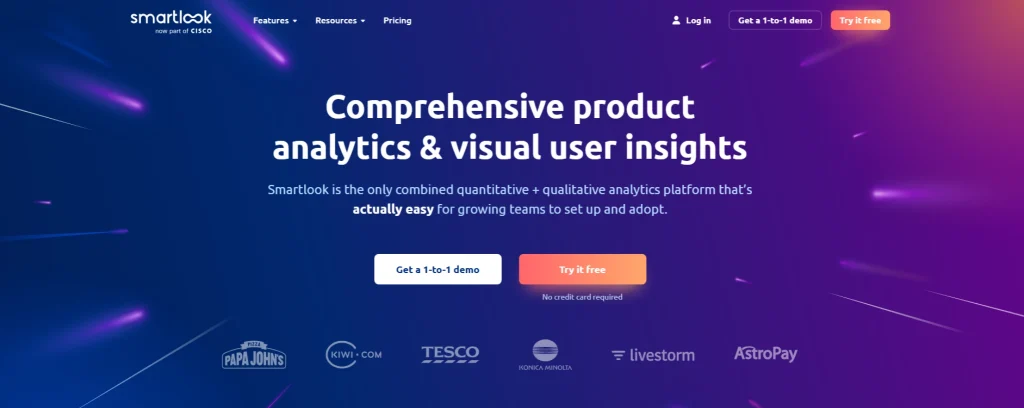
Smartlook is a cross-platform behavioral analytics tool built natively for teams managing both web and mobile apps. It belongs to the web and mobile platforms analytics category and was designed from the start with mobile SDKs, giving it stronger mobile platform support than most web-first competitors.
The differentiating feature is retroactive analytics. You can apply new filters, event definitions, and user segments to historical data without waiting for new sessions to accumulate. This flexibility matters when you realize mid-sprint that you need to answer a question you forgot to track at launch.
- Learn more about Smartlook alternatives.
- See how Smartlook compares to Hotjar.
Best for
Product managers and mobile app teams working across web and mobile who need event-based funnel analytics, retroactive filtering, crash reporting, and cross-platform heatmaps from a single SDK installation.
Key features
- Cross-platform recordings covering both web and native mobile apps, with the ability to replay actual user sessions across platforms from one unified interface
- Heatmaps show click, scroll, and hover behavior for web pages and native mobile screens without separate SDK configurations
- Event-based funnels with anomaly detection that automatically flags unexpected changes in conversion rates
- Retroactive analytics applies new filters and event rules to historical data so you can answer new questions without waiting for fresh sessions
- Crash reporting links app crashes directly to session footage for faster engineering diagnosis
- Error tracking shows frustrated tapping, dead clicks, and crash events across web and mobile experiences simultaneously
Pricing
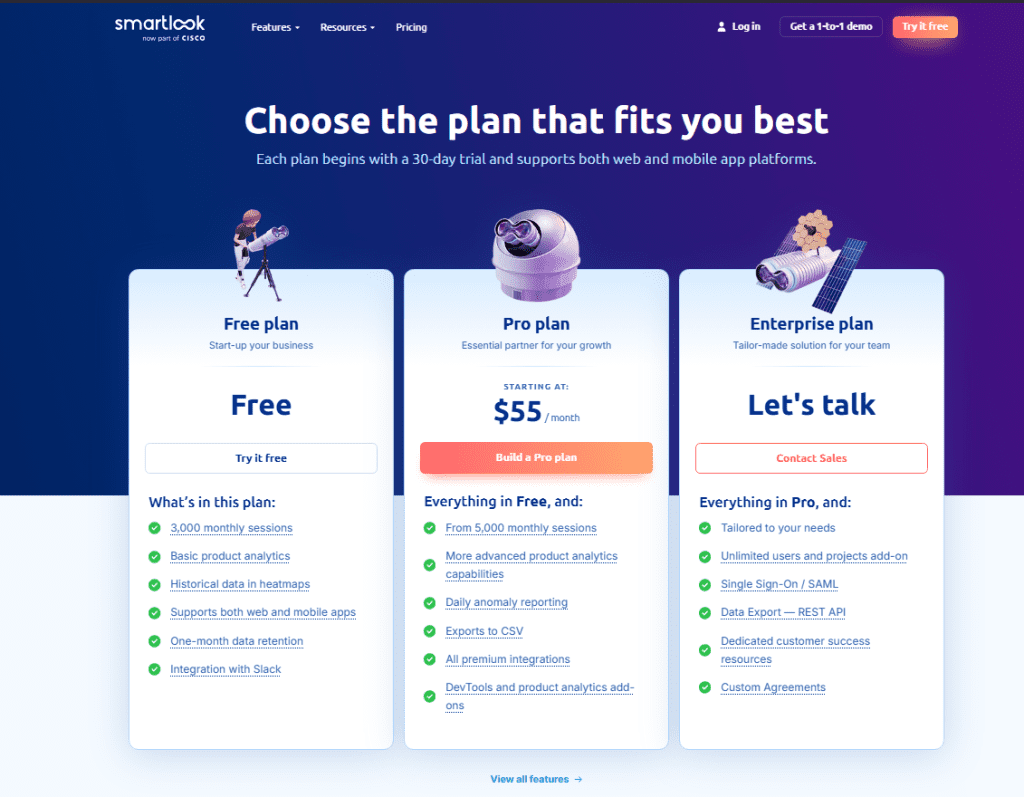
Smartlook offers a free plan with 3,000 monthly sessions and a 30-day retention window.
Subscription tiers start at $55/month, which is higher than most entry-level options on this list.
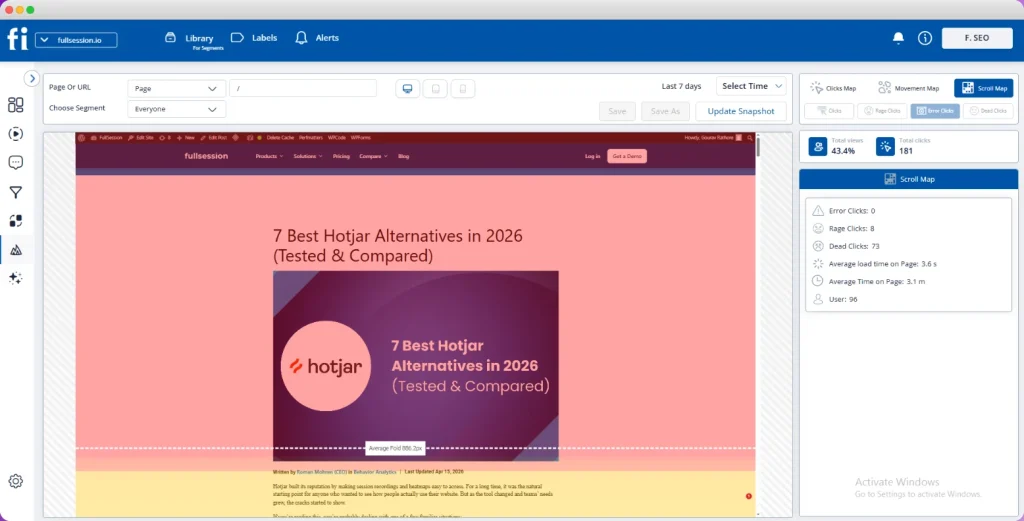
6. Mouseflow
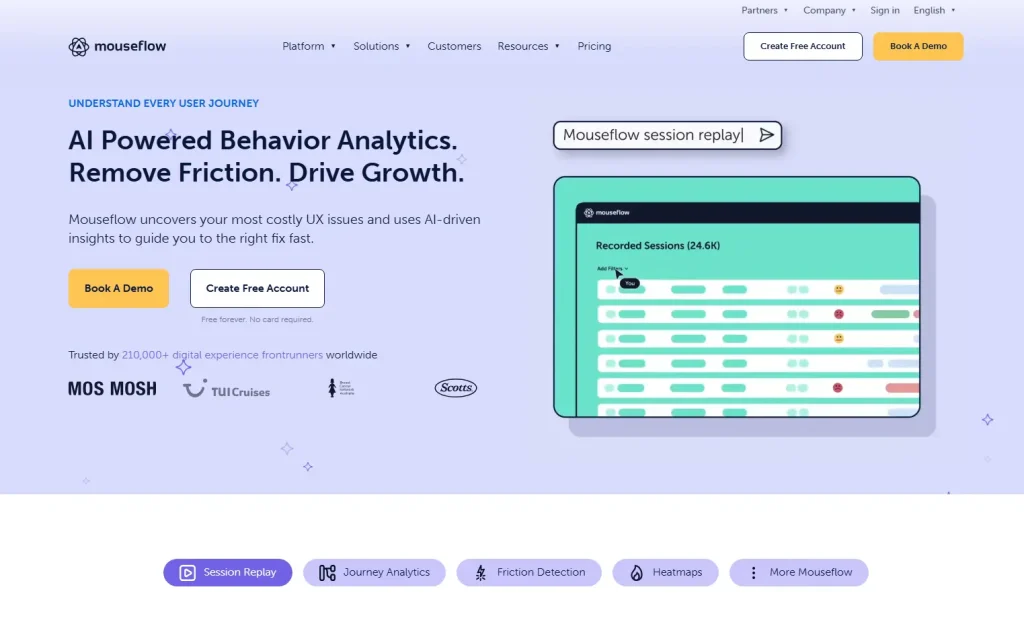
Mouseflow is a web analytics and conversion optimization platform. It offers seven heatmap views, including a geographic option that shows where in the world your traffic is browsing from, and a live heatmap that updates as real users interact with your site.
What makes Mouseflow different from the other tools here is automated friction detection.
The platform scores every recorded session based on repeated failed clicks, error clicks, and erratic navigation patterns. Your team sorts by friction score to identify pain points without randomly reviewing footage.
- See how Mouseflow compares to FullSession.
- Learn more about Mouseflow vs VWO.
Best for
Digital marketing managers and CRO specialists focused on website conversion optimization who want a broad selection of heatmap views, solid form analytics, and built-in friction scoring without an enterprise contract.
Key features
- Seven heatmap types covering click, scroll, movement, attention, friction, interactive, and geographic data
- Session recordings with friction scoring flag high-frustration visits automatically, so your team knows where to focus
- Conversion funnels track user journeys through your site step by step, showing exactly where drop-offs concentrate across acquisition flows
- Form analytics with field-level data capture, which fields cause users to scroll past, abandon, or repeatedly correct their inputs
- Journey analytics maps how users navigate from entry to exit, surfacing unexpected user paths your team would otherwise miss
- GDPR and CCPA compliant with configurable masking and role-based access controls
Pricing
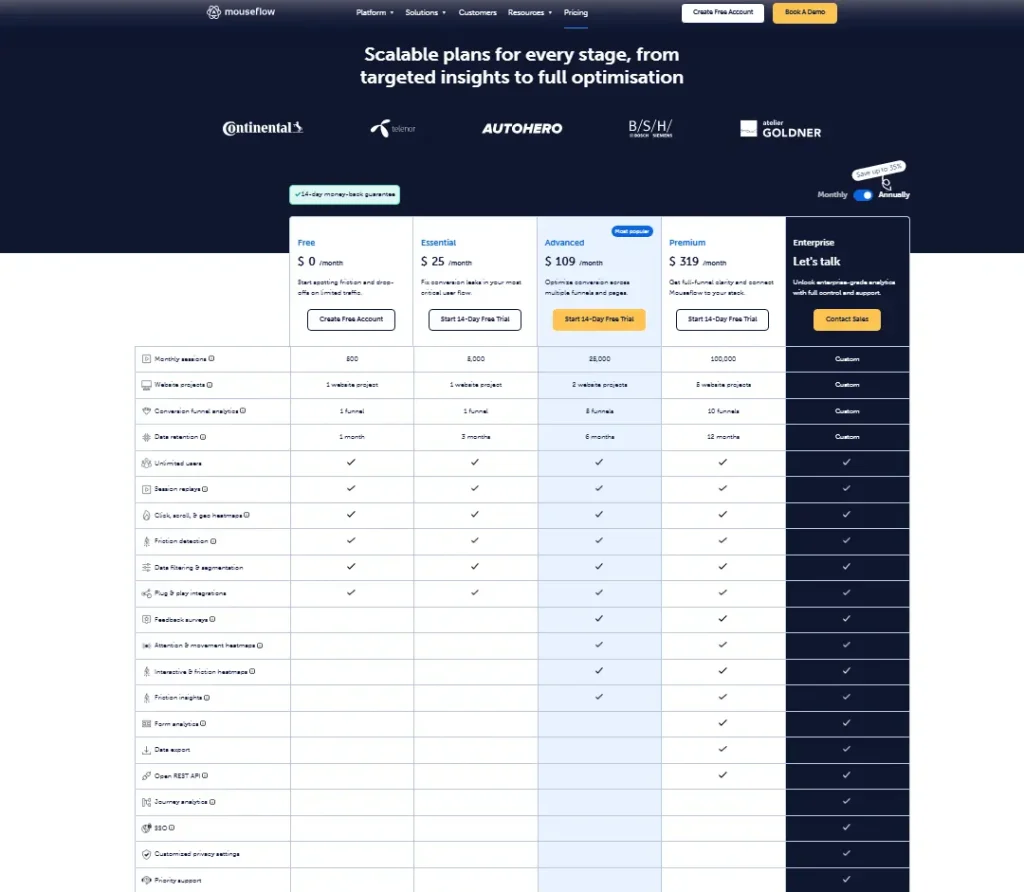
Mouseflow’s free plan covers 500 recorded sessions per month.
Subscriptions start at $39/month for 5,000 sessions with a 90-day retention on entry plans.
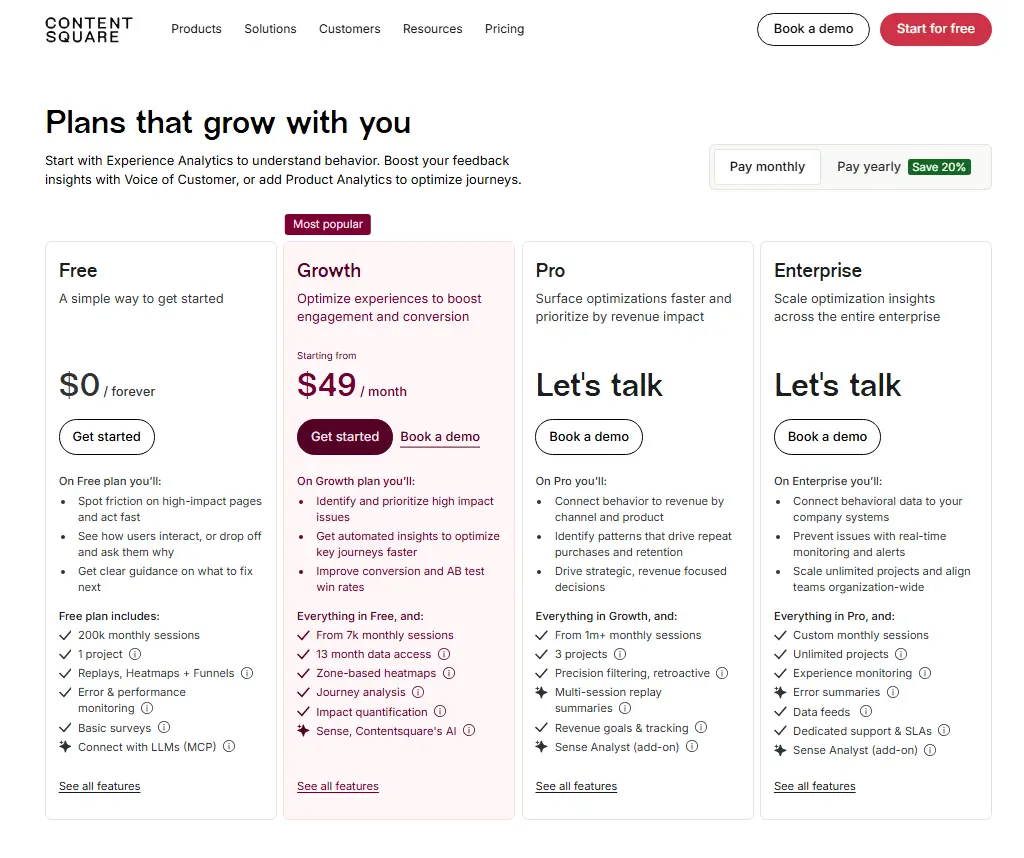
7. Contentsquare

Contentsquare is an enterprise digital experience analytics platform built for large organizations with complex multi-page journeys and dedicated analytics teams. It now includes Hotjar and Heap within the same product group.
What separates Contentsquare is revenue attribution at the element level. The platform assigns revenue credit to specific page zones, giving enterprise e-commerce and financial services teams a direct line from behavioral data to business outcomes.
See how Contentsquare compares with FullSession.
Best for
Enterprise analytics teams at large retail, media, and financial services organizations that have the budget, technical resources, and organizational scale to use a full digital experience platform.
Key features
- Zone-based heatmaps attribute conversion events and revenue to specific page elements rather than just recording where users click across the page
- Recorded visits with AI struggle detection that automatically surfaces sessions where users show signs of confusion or intent abandonment
- Customer journey mapping traces visitor behavior across multiple visits and devices, building a fuller picture than single-visit analysis alone
- Advanced segmentation capabilities slice behavioral data by customer lifetime value, campaign source, device type, and custom attributes
- Robust documentation and a dedicated implementation team support enterprise deployment
- Compliance-grade data capture for regulated industries with configurable PII masking and audit logging
Pricing
Contentsquare provides a free plan with up to 200k monthly sessions.
Paid plans start at $49/month for up to 10M monthly sessions and 13 months of data retention.
How to Choose the Right UX Heatmap Tool
Five questions narrow the field for most teams.
- What’s your primary use case? Teams debugging UX problems need strong recording capabilities and frustration signal detection above everything else. Teams running a conversion optimization program need funnel tracking and A/B testing integration. Teams collecting direct feedback need built-in survey tools alongside the heatmaps.
- Do you need web-only or cross-platform coverage? Hotjar and Mouseflow are web-only tools. Smartlook, FullStory, and FullSession cover both natively. If your product includes a native mobile app, eliminate web-only platforms before you evaluate anything else.
- What’s your team’s technical capacity? FullStory and Contentsquare require significant onboarding and, in most cases, engineering involvement. FullSession, Hotjar, and Microsoft Clarity are self-serve and can be deployed in minutes. Match the tool to what your team can manage independently.
- How long do you need to store your data? Microsoft Clarity keeps 90 days. Hotjar subscriptions are valid for 365 days. FullSession Professional keeps it for eight months. FullSession Enterprise stores 15 months. If you need to understand how user satisfaction changes across seasons or product releases, check the data retention limits before committing.
- What does the total price actually include? Many platforms advertise low entry prices and then charge separately for analytics features that should be standard. Get a full feature breakdown for the specific plan you intend to use, not just the headline number.
Start a free trial with FullSession and see heatmaps, session recording, and error tracking live on your own site. No credit card required.
Is FullSession the Best Website Heatmap Tool?
There are strong, well-established tools in this category, and some are genuinely worth considering depending on your situation.
For teams that need to move quickly from behavioral observation to concrete decisions, without managing multiple subscriptions or sitting through enterprise sales cycles, FullSession consistently stands out.
One platform, everything connected
Most teams end up paying for three or four separate tools to cover what FullSession handles in one subscription: session recording and replay, interactive heatmaps, conversion funnels, error monitoring, in-app feedback, and mobile analytics for iOS and Android.
Everything connects on one dashboard from day one. When you spot a drop-off in a conversion funnel analysis, you click through to the recordings for that exact step. From any recording, the heatmap tab is one click away. No advanced features are locked behind a higher plan.
From observation to action with Lift AI
The most expensive problem in analytics isn’t missing data. It’s the gap between seeing a problem and knowing which one to fix first. That’s where weeks disappear.
FullSession’s Lift AI closes it.
It scans the full behavioral data layer, ranks friction points by revenue impact, links each priority to the specific sessions where it occurs, and validates outcomes after you ship a fix. No other tool on this list offers that closed-loop prioritization at any price point.
Built for teams that don’t have time to become analysts
Behavioral analytics tools are only valuable if the people who need insights can actually use them. FullSession’s interface is clean enough for product managers, marketers, and customer success teams to work independently without a training session or engineering support.
Filters, session search, and heatmap views are all designed so non-technical users can review user flow data, identify friction points, and act on what they find.
That’s a real operational advantage over tools that require dedicated data team involvement before most people can work without help.
Proactive detection before problems escalate
On most platforms, you learn about broken flows when customers report them. FullSession’s Errors and Alerts dashboard shows exactly where users encounter problems in real time, giving your team the context to act before issues reach a support queue.
This changes the operational rhythm for teams managing conversion-critical flows where every broken visit carries a direct revenue cost.
Performance that won’t slow you down
FullSession’s SDK runs asynchronously on a separate thread. Page load times and Core Web Vitals stay untouched. You get full behavioral coverage across web and mobile apps without the overhead that heavier SDKs introduce.
Transparent pricing, no surprises
The Growth plan starts at $23/month, billed annually. It includes 5,000 sessions, full heatmaps, funnels, user feedback tools, and Lift AI. Every pricing tier is published publicly so you can evaluate fit before any sales conversation. Most competitors charge separately for the analytics features that FullSession bundles by default.
One honest caveat
FullSession currently has fewer native third-party integrations than some of the larger competitors. However, we welcome integration requests as part of any enterprise engagement. If it’s a blocker to adoption, we build it. Responsiveness is something we can still offer that the larger players can’t.
Book a demo to see how FullSession handles your specific workflows.
Conclusion About UX Heatmap Tools
The seven tools in this guide cover the full range of what the UX heatmap category offers in 2026.
For teams that need to move quickly from behavioral data to decisions without adding complexity or hidden costs, FullSession offers the strongest combination of depth, accessibility, and value in the category today.
Start a free trial with FullSession to see what your users are actually doing on your site today.
Ready for a guided walkthrough? Book a demo, and a product specialist will show you exactly how heatmaps, session recording, and Lift AI work together on your specific pages.
FAQs About UX Heatmap Tools
What is the best free UX heatmap tool?
Microsoft Clarity is the leading free option, offering heatmaps and session recording at no cost with no session caps or traffic limits. It works well for teams already using Google Analytics or Google Tag Manager who want to add visual behavioral data.
For teams that need more than basic tracking, FullSession’s free plan covers 500 sessions per month and includes interactive heatmaps, session recording, and frustration signal detection at no charge.
How do heatmap tools provide insights into how users navigate a site?
Heatmap tools provide insight by placing a lightweight JavaScript SDK on your site or app that records how users navigate and what user interactions occur during every visit. The platform aggregates those signals into a color-coded overlay on your actual pages.
Red areas show high engagement. Blue areas show where scroll depth drops and attention falls off. This converts raw session data into something your team can act on without interpreting tables of abstract data points.
Can heatmap tools work on dynamic pages and single-page apps?
Most modern tools support dynamic pages and single-page applications natively. FullSession, Smartlook, and FullStory handle SPAs and dynamically rendered components without additional setup.
Some platforms fall back to static snapshots that miss the state of interactive elements like dropdowns, modals, and cart overlays. Test your most complex pages before committing to any platform.
What is the difference between a heatmap and a session recording?
A heatmap shows aggregate visitor behavior patterns across all visits during a selected window, giving you a macro view of where users focus, click, and abandon.
A session recording reconstructs an individual visit as a video-like playback, so you can watch user sessions and see exactly what a specific visitor clicked, where they hesitated, and where they left off.
Heatmaps identify patterns at scale. Session recording explains the behavior behind them at the individual level. Testing tools that combine both, like FullSession, let you move between views without switching platforms.
Do heatmap tools affect website performance?
Most modern tools use asynchronous loading, so the tracking script doesn’t block page rendering or delay above-the-fold content. FullSession’s SDK runs on a separate thread with no measurable impact on Core Web Vitals.
Performance impact varies across platforms; some enterprise SDKs add more overhead than lightweight tools. Run a Core Web Vitals check after installation, regardless of which platform you choose.

Roman Mohren is CEO of FullSession, a privacy-first UX analytics platform offering session replay, interactive heatmaps, conversion funnels, error insights, and in-app feedback. He directly leads Product, Sales, and Customer Success, owning the full customer journey from first touch to long-term outcomes. With 25+ years in B2B SaaS, spanning venture- and PE-backed startups, public software companies, and his own ventures, Roman has built and scaled revenue teams, designed go-to-market systems, and led organizations through every growth stage from first dollar to eight-figure ARR. He writes from hands-on operator experience about UX diagnosis, conversion optimization, user onboarding, and turning behavioral data into measurable business impact.